 48
48peptides
spectra
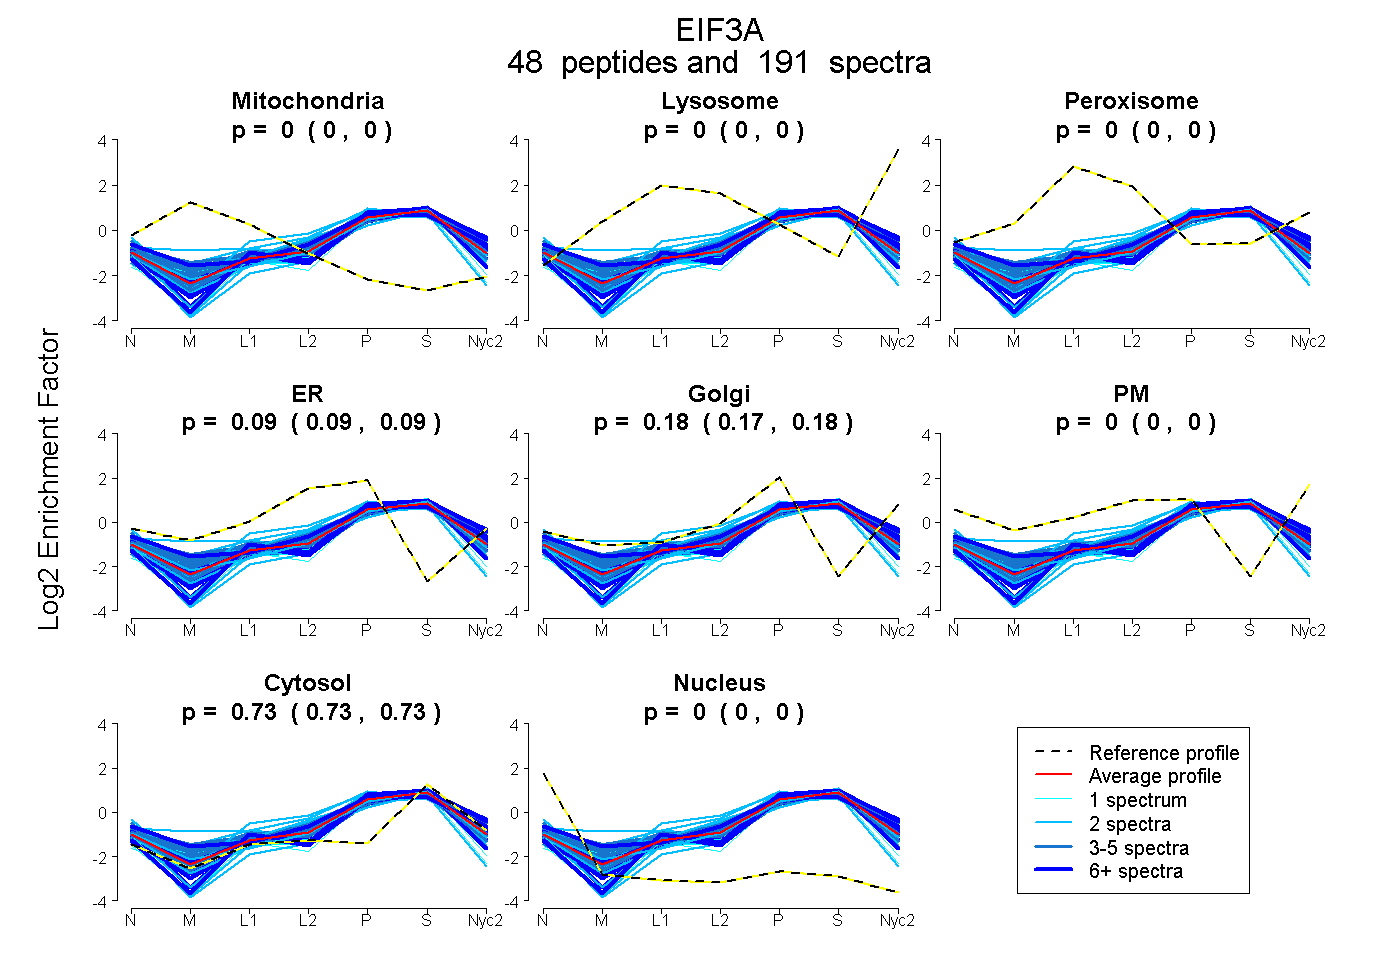
0.000 | 0.000
0.000 | 0.000
0.000 | 0.000
0.089 | 0.095
0.175 | 0.181
0.000 | 0.000
0.729 | 0.731
0.000 | 0.000
26peptides
spectra
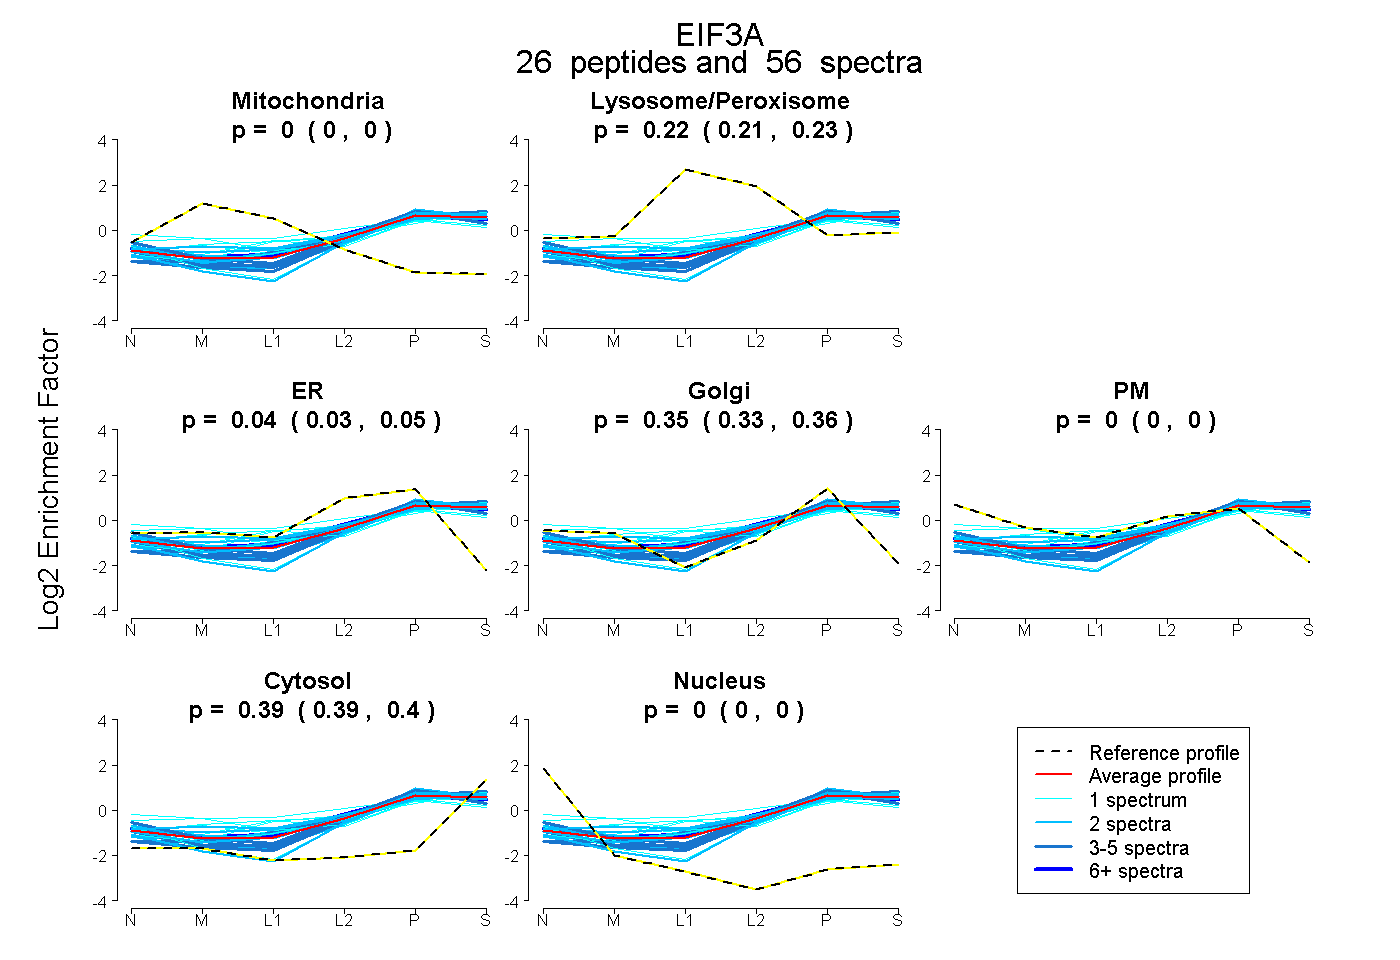
0.000 | 0.000
0.213 | 0.227
0.027 | 0.054
0.333 | 0.355
0.000 | 0.000
0.388 | 0.397
0.000 | 0.000
40peptides
spectra
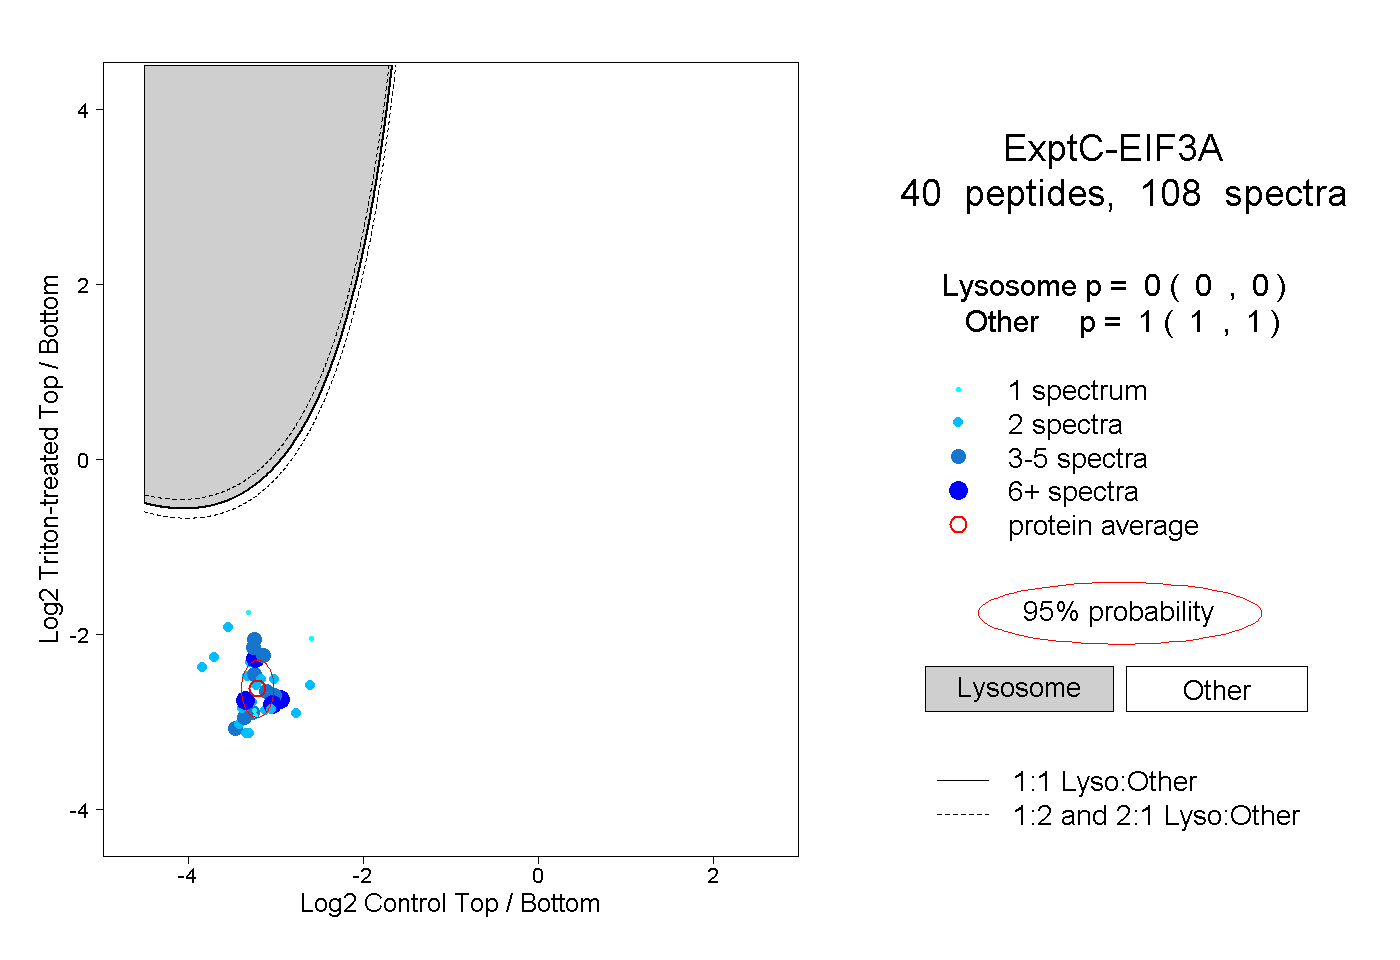
0.000 | 0.000
1.000 | 1.000
13peptides
spectra
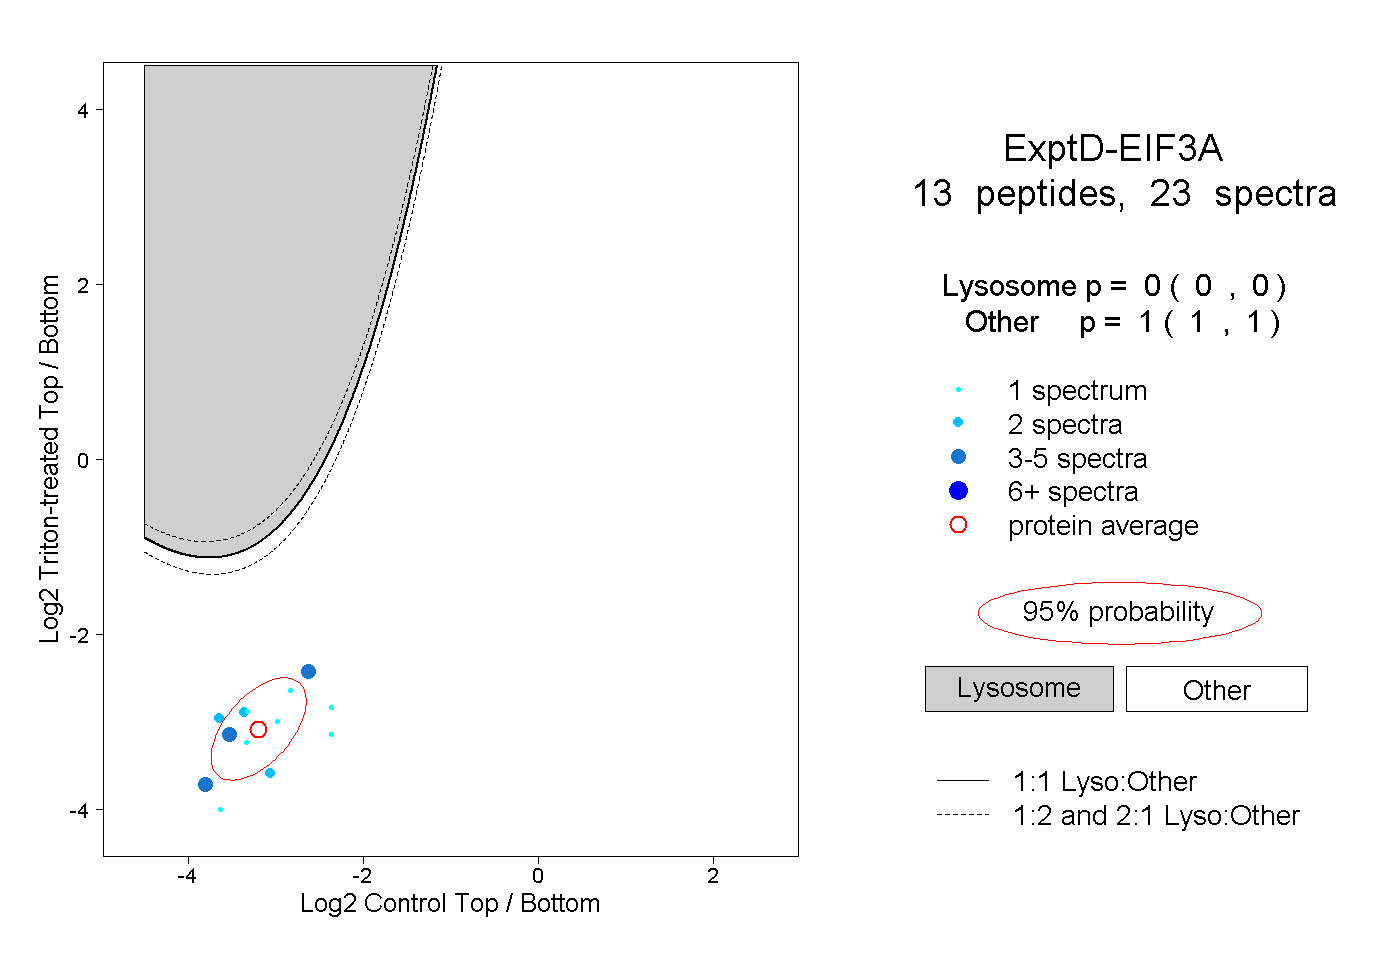
0.000 | 0.000
1.000 | 1.000