 27
27peptides
spectra
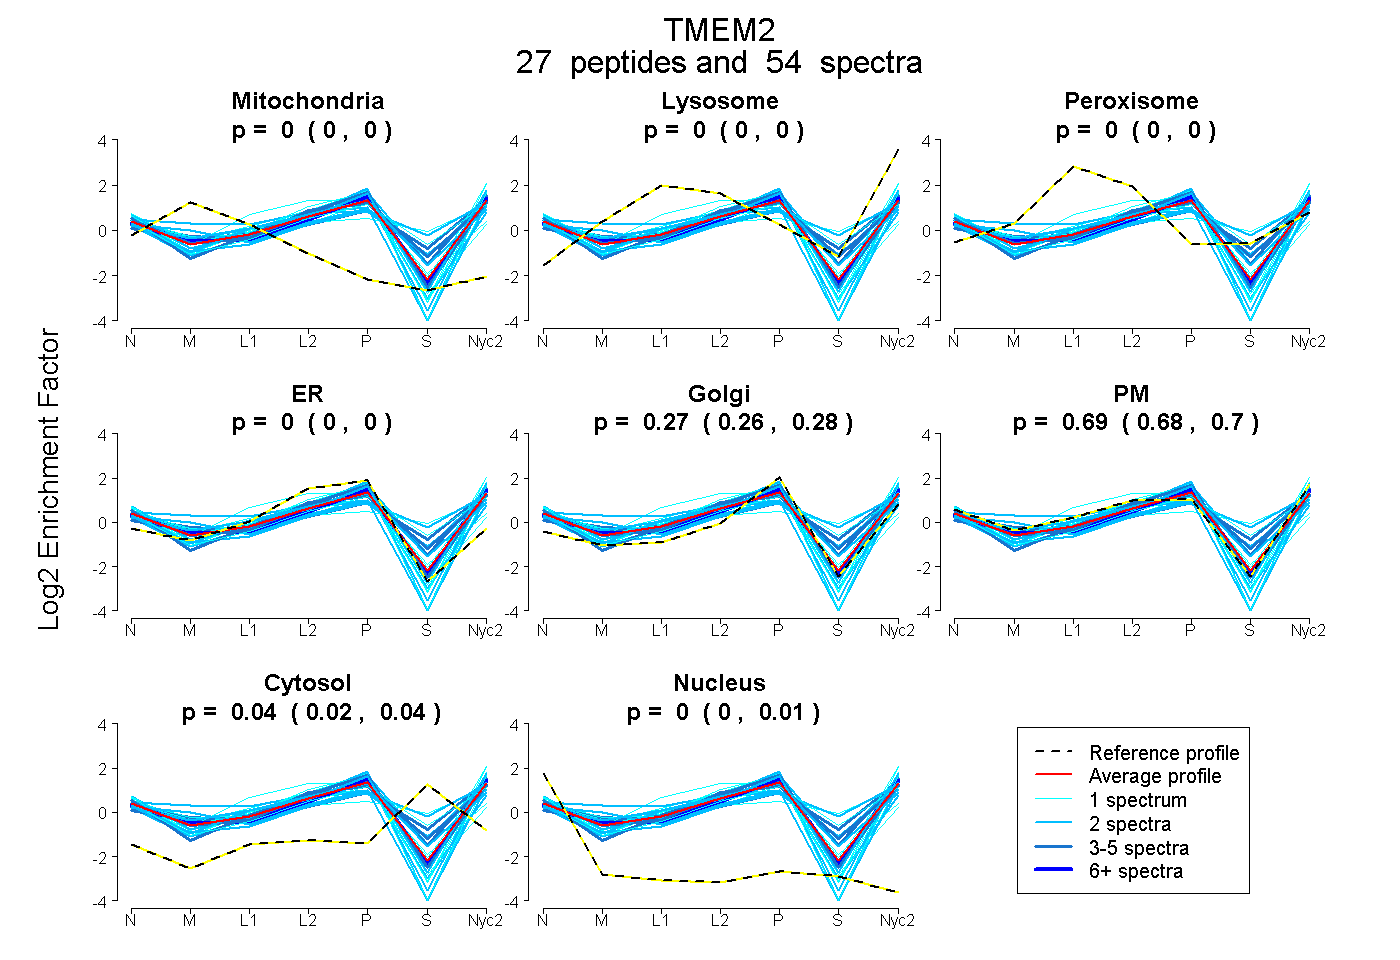
0.000 | 0.000
0.000 | 0.000
0.000 | 0.000
0.000 | 0.004
0.262 | 0.280
0.684 | 0.697
0.024 | 0.042
0.000 | 0.005
3peptides
spectra
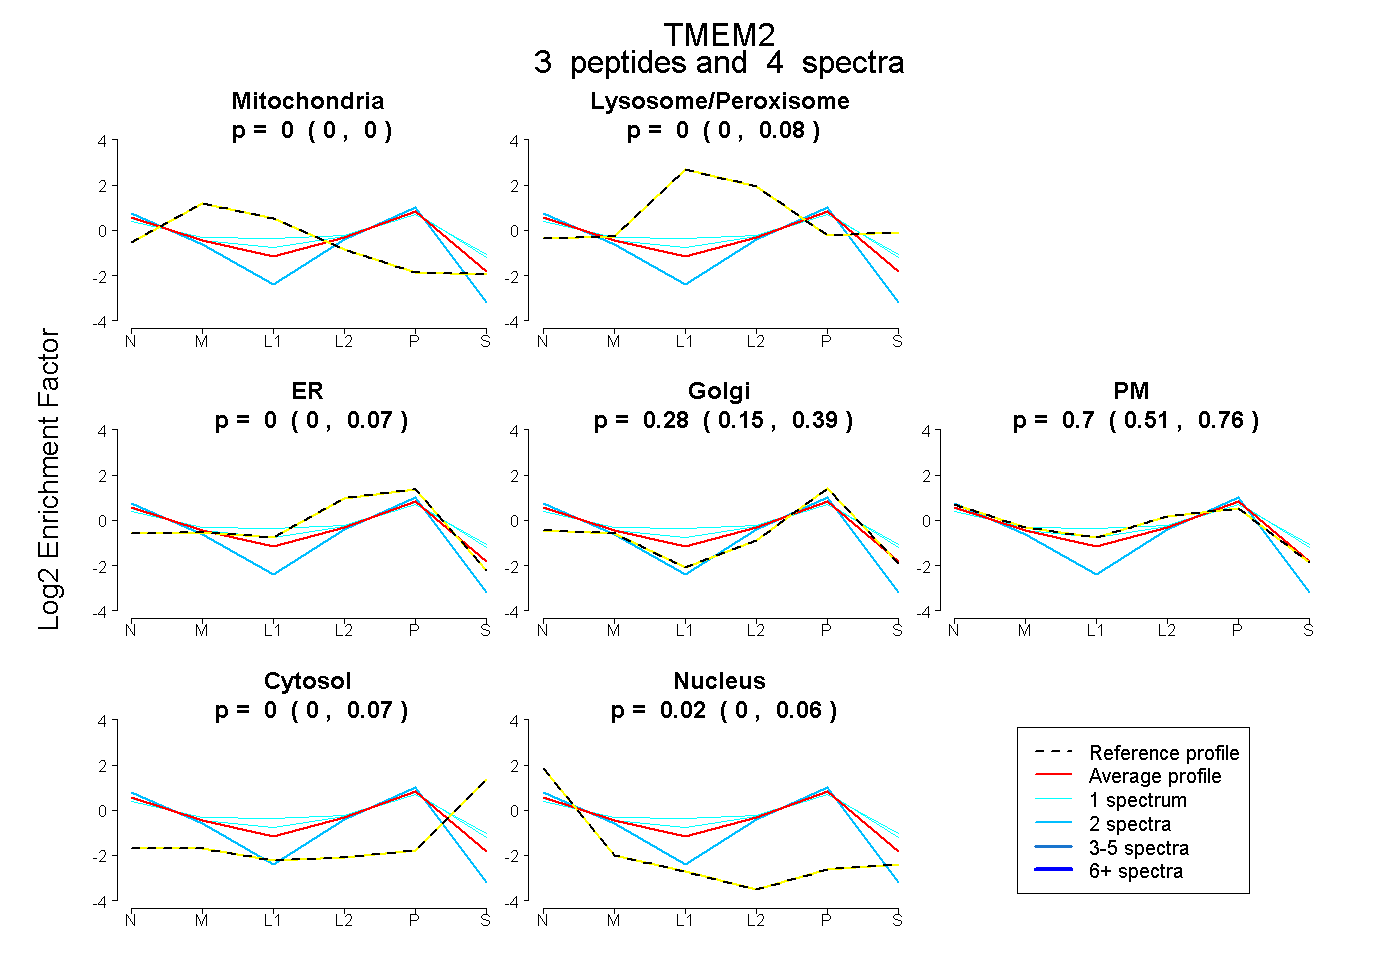
0.000 | 0.000
0.000 | 0.076
0.000 | 0.072
0.152 | 0.390
0.509 | 0.764
0.000 | 0.075
0.000 | 0.060
30peptides
spectra
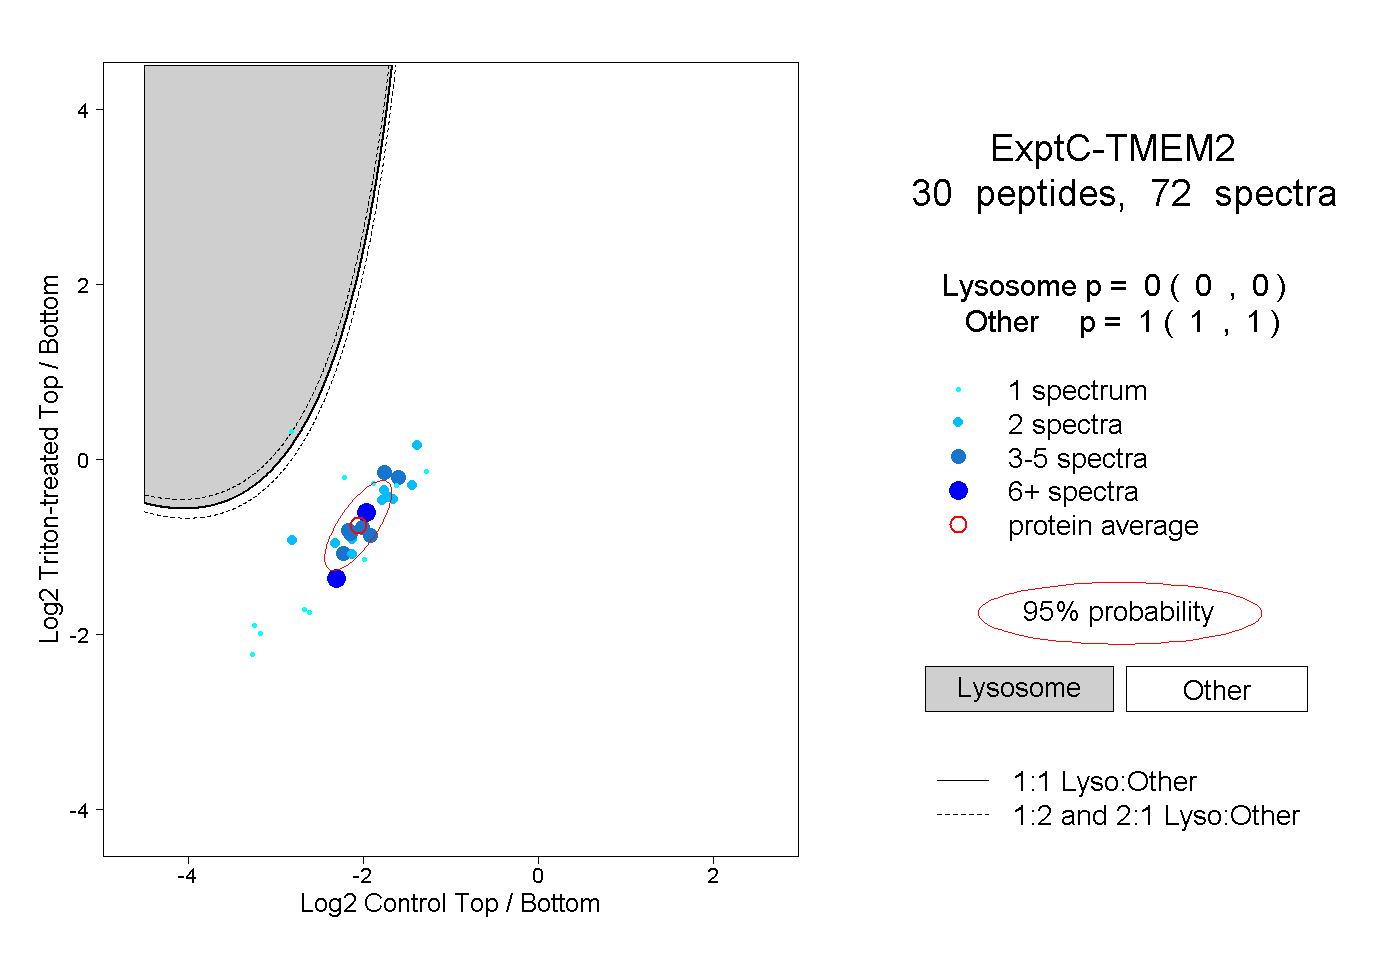
0.000 | 0.000
1.000 | 1.000
3peptides
spectra
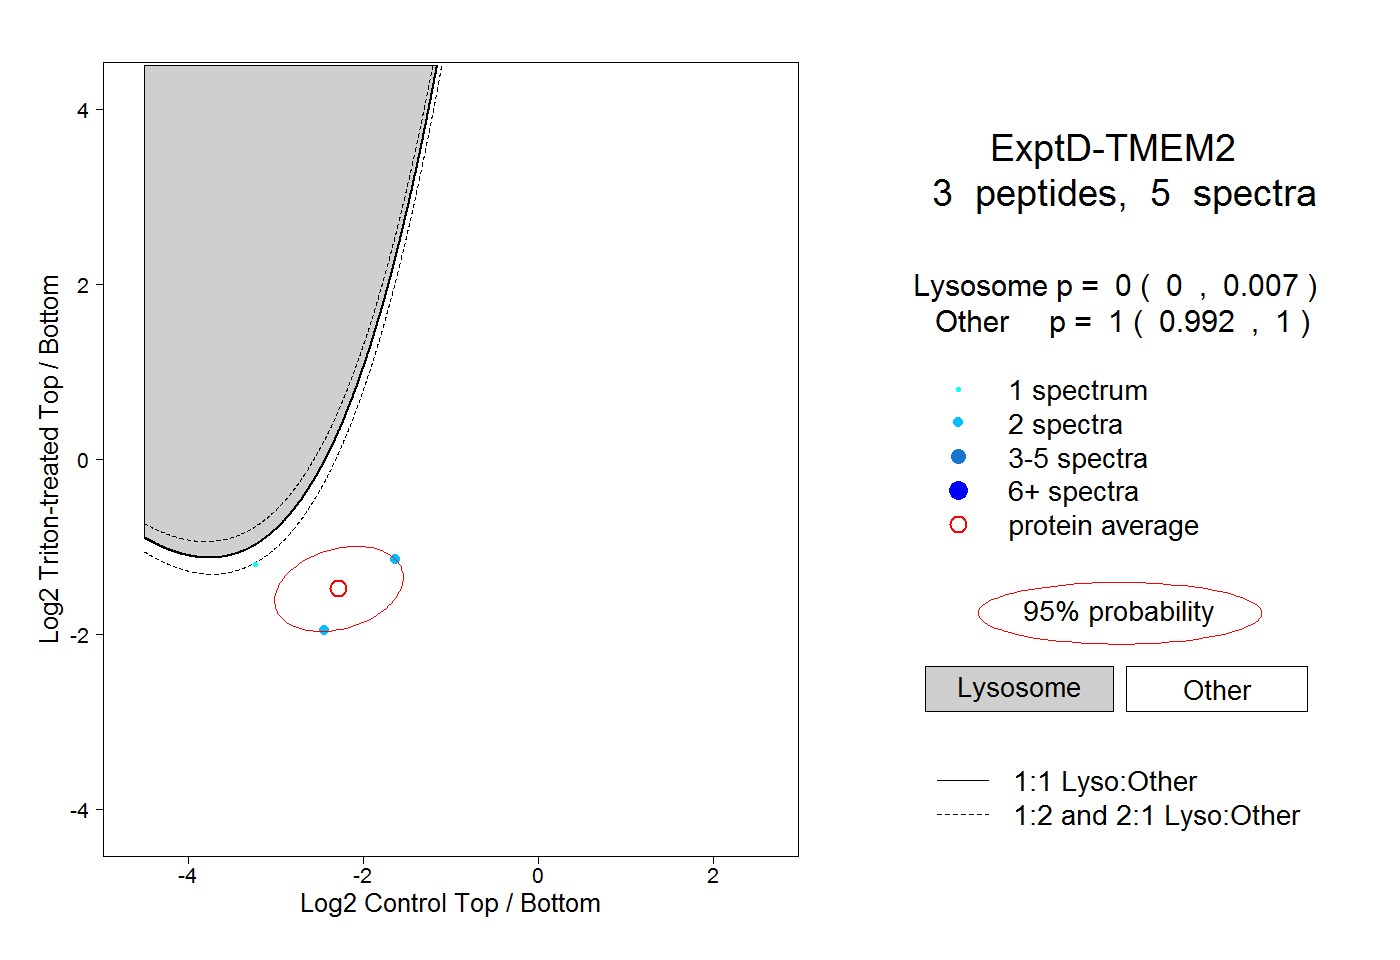
0.000 | 0.007
0.992 | 1.000