| 2 spectra, YAPDENCPDQNPR |
|
0.000 |
|
|
|
|
|
|
|
1.000 |
| 2 spectra, SIVLLSTR |
|
0.000 |
|
|
|
|
|
|
|
1.000 |
| 2 spectra, NWDPGQDSAK |
|
0.000 |
|
|
|
|
|
|
|
1.000 |
| 4 spectra, SPGYVPGK |
|
0.000 |
|
|
|
|
|
|
|
1.000 |
| 1 spectrum, HPNCVSVTK |
|
0.000 |
|
|
|
|
|
|
|
1.000 |
| 2 spectra, IQAATDSK |
|
0.000 |
|
|
|
|
|
|
|
1.000 |
| 1 spectrum, ALAQGEFYTLDGQK |
|
0.000 |
|
|
|
|
|
|
|
1.000 |
| 2 spectra, YVPTPDR |
|
0.000 |
|
|
|
|
|
|
|
1.000 |
| 2 spectra, IVAIAVGDSAVK |
|
0.000 |
|
|
|
|
|
|
|
1.000 |
| 2 spectra, KPSAVK |
|
0.000 |
|
|
|
|
|
|
|
1.000 |
| 2 spectra, EYLCLDNSAR |
|
0.000 |
|
|
|
|
|
|
|
1.000 |
| 2 spectra, YILIQDGGALHIGAEK |
|
0.000 |
|
|
|
|
|
|
|
1.000 |
| 2 spectra, DLELLQQALK |
|
0.000 |
|
|
|
|
|
|
|
1.000 |
| 7 spectra, VIDQDTAR |
|
0.000 |
|
|
|
|
|
|
|
1.000 |
| 1 spectrum, IEEYEPAQSMEELQK |
|
0.812 |
|
|
|
|
|
|
|
0.188 |
| 5 spectra, AEVGILTR |
|
0.000 |
|
|
|
|
|
|
|
1.000 |
| 5 spectra, LIQGLGYR |
|
0.000 |
|
|
|
|
|
|
|
1.000 |
| 1 spectrum, VVPFRPAPPPK |
|
0.000 |
|
|
|
|
|
|
|
1.000 |
| 1 spectrum, VAAVIDR |
|
0.000 |
|
|
|
|
|
|
|
1.000 |
| 1 spectrum, YMGTGGIDQKPR |
|
0.000 |
|
|
|
|
|
|
|
1.000 |
| 4 spectra, VHSNFK |
|
0.000 |
|
|
|
|
|
|
|
1.000 |
| 7 spectra, DEYPSHPMVLR |
|
0.000 |
|
|
|
|
|
|
|
1.000 |
| 1 spectrum, SQEAPATFAFSPEEQR |
|
0.000 |
|
|
|
|
|
|
|
1.000 |
| 3 spectra, SYLPVR |
|
0.000 |
|
|
|
|
|
|
|
1.000 |
| 1 spectrum, GYTIHWSGPAPR |
|
0.000 |
|
|
|
|
|
|
|
1.000 |
| 1 spectrum, NYGSQGGQNK |
|
0.000 |
|
|
|
|
|
|
|
1.000 |
| 1 spectrum, AGLFVDK |
|
0.000 |
|
|
|
|
|
|
|
1.000 |
| 3 spectra, AYPQYYK |
|
0.000 |
|
|
|
|
|
|
|
1.000 |
| 3 spectra, DTYVGR |
|
0.000 |
|
|
|
|
|
|
|
1.000 |
| 1 spectrum, HLQEK |
|
0.000 |
|
|
|
|
|
|
|
1.000 |
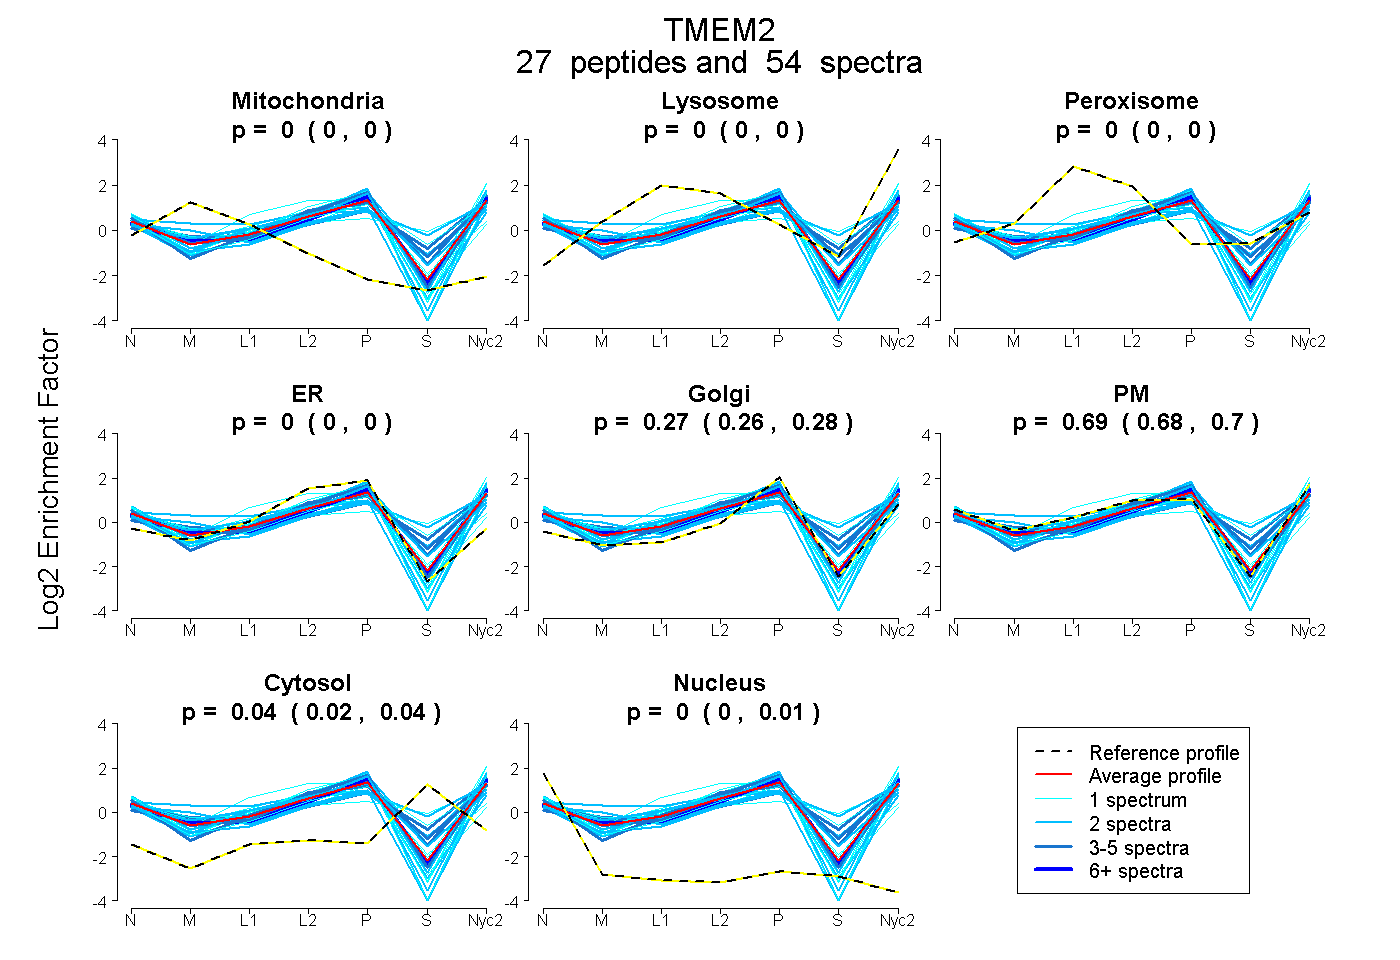
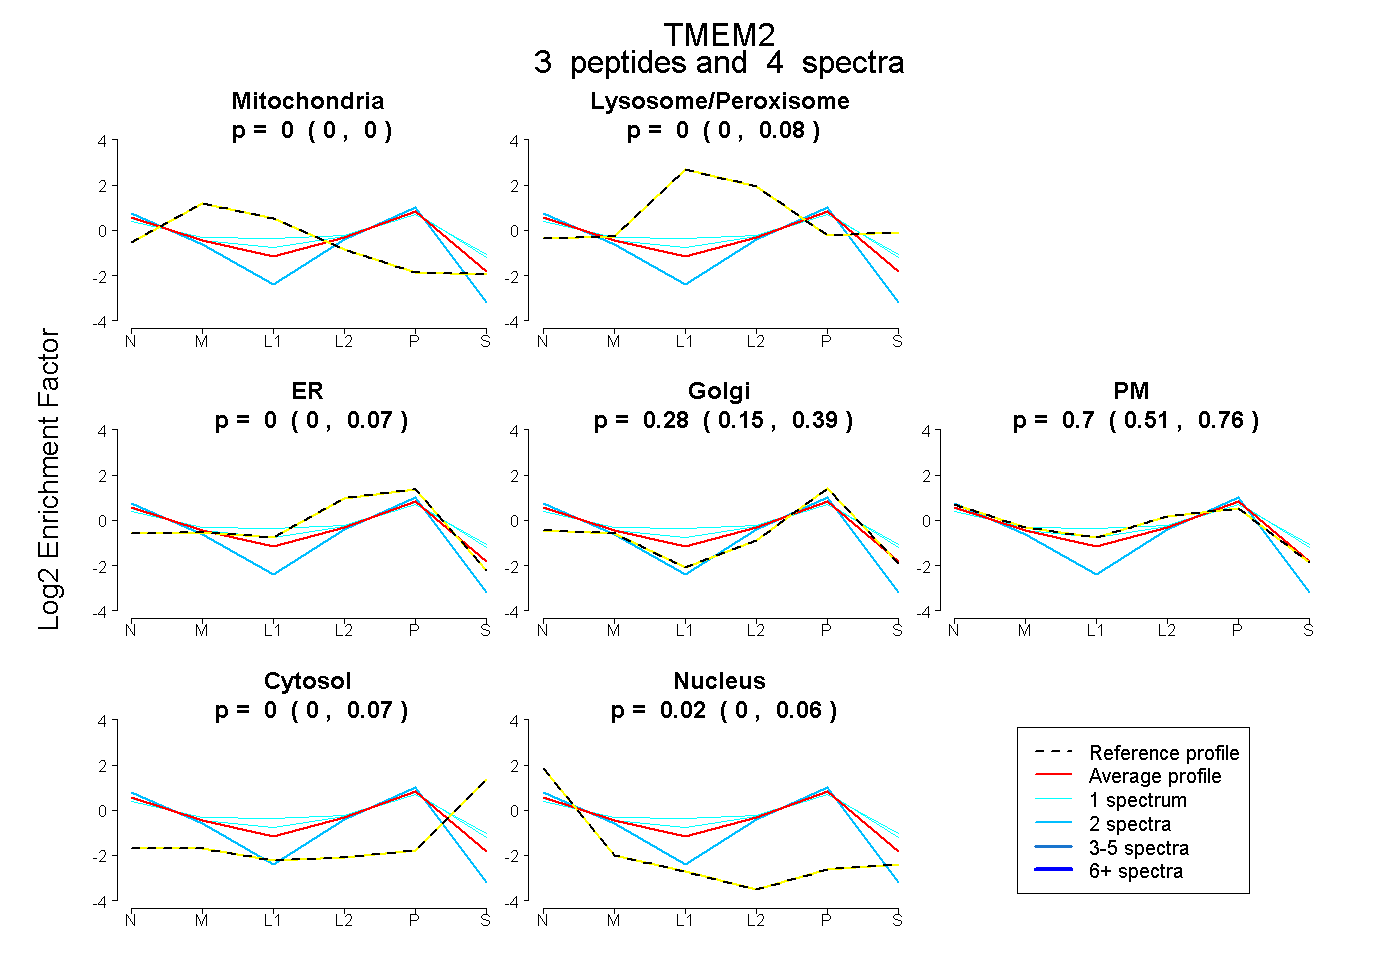
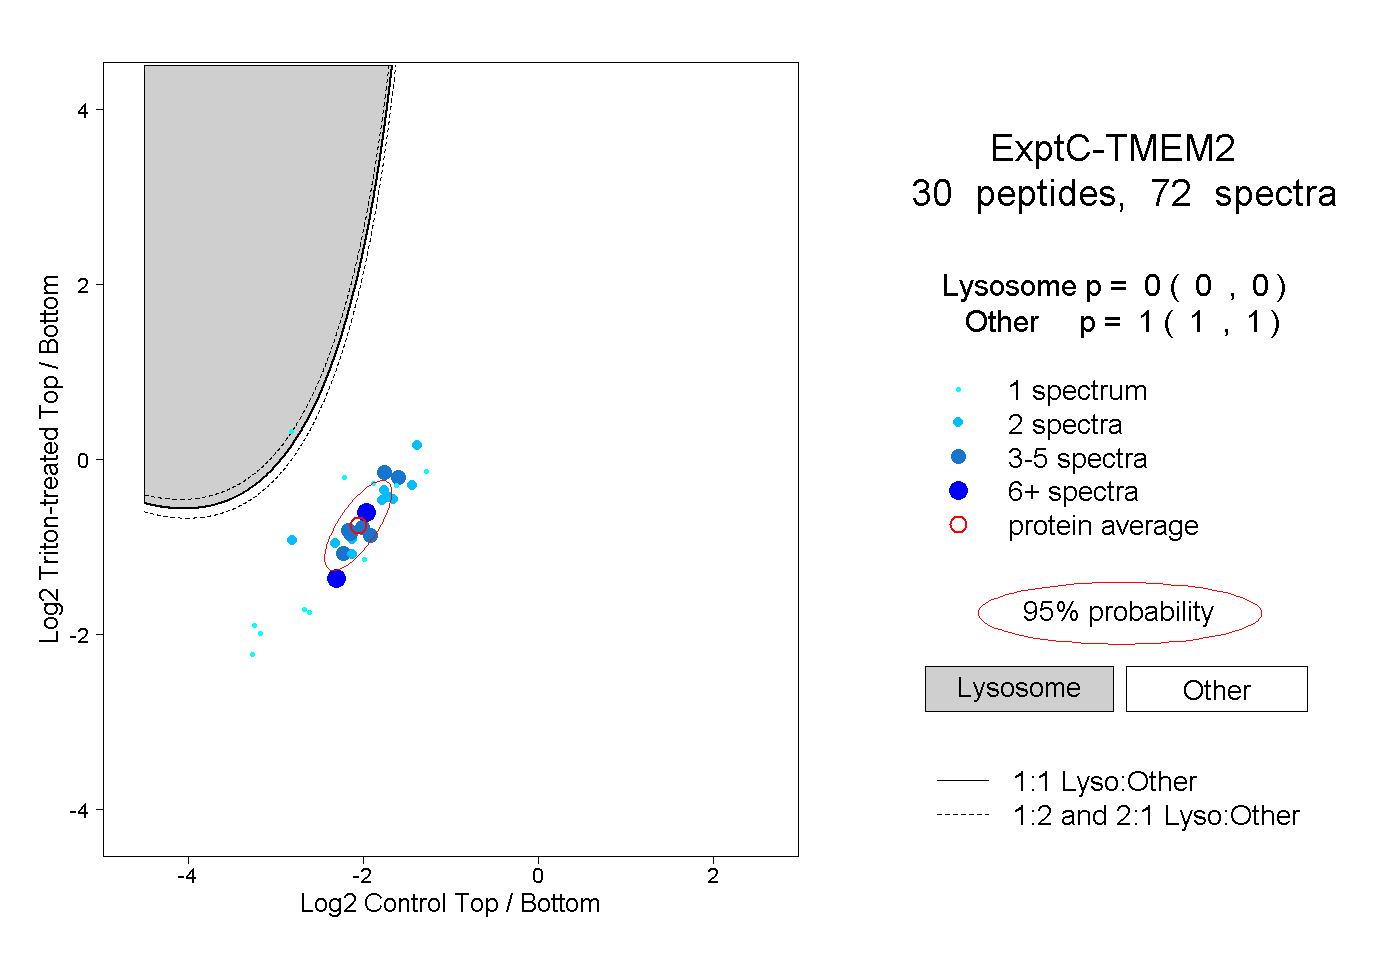
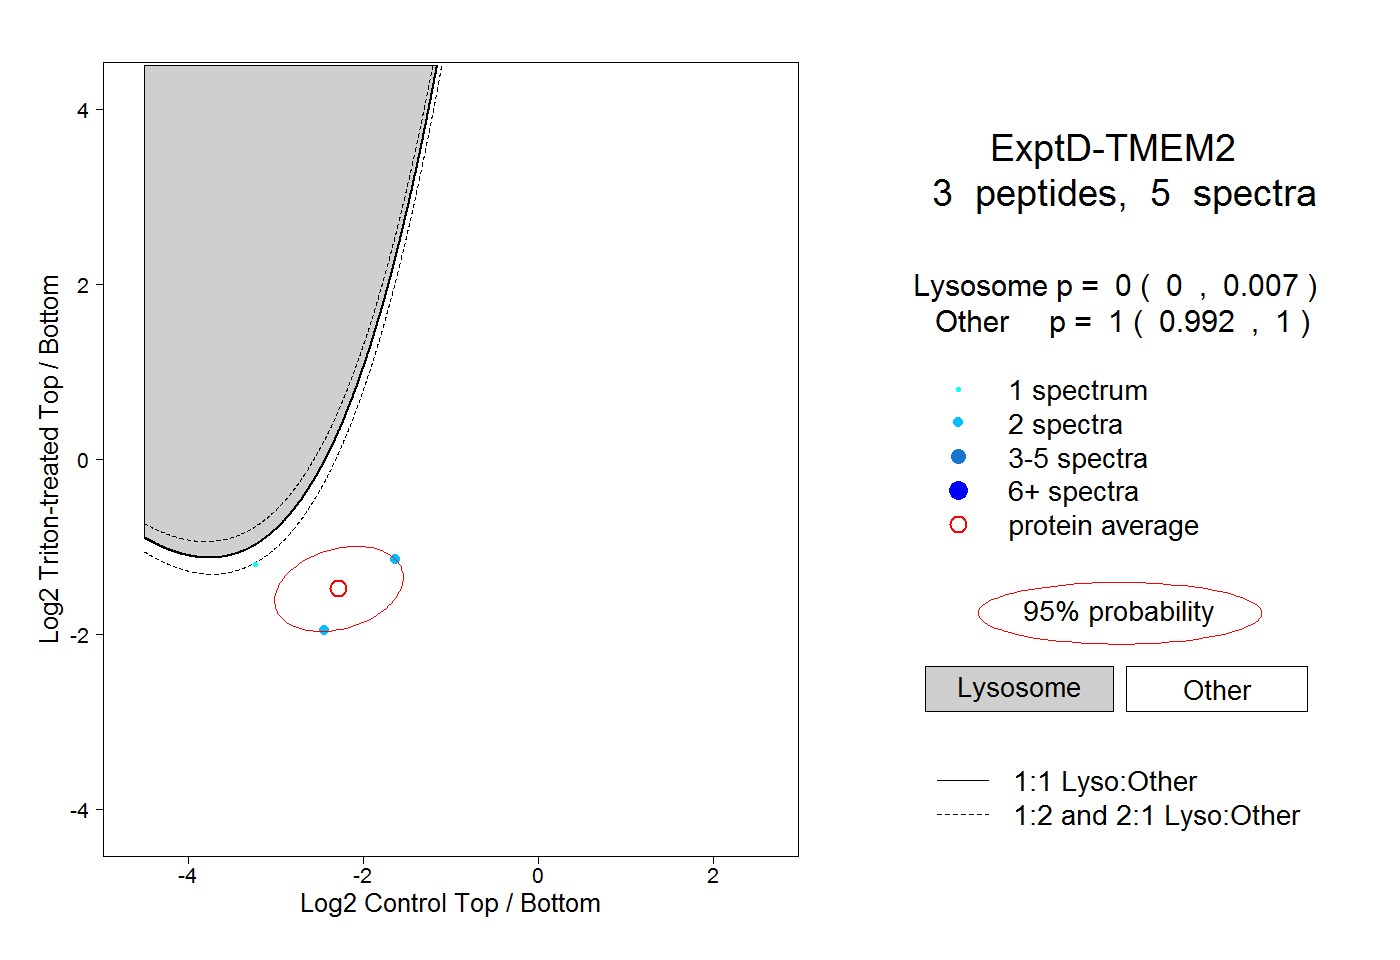
 27
27