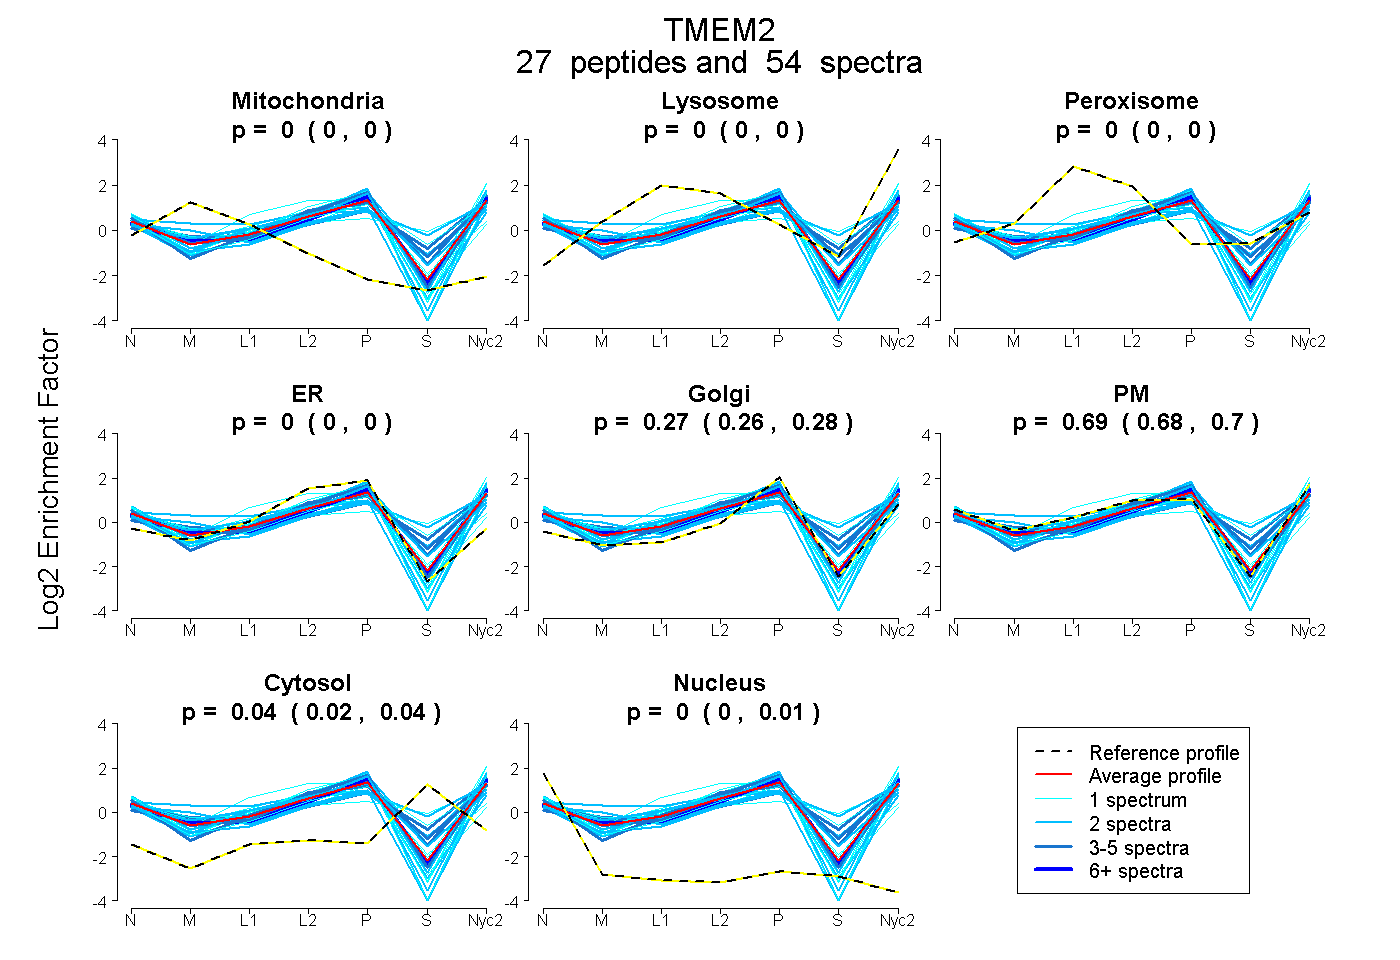
 27
27peptides
spectra
0.000 | 0.000
0.000 | 0.000
0.000 | 0.000
0.000 | 0.004
0.262 | 0.280
0.684 | 0.697
0.024 | 0.042
0.000 | 0.005
| Plot | Mito | Lyso | Perox | ER | Golgi | PM | Cytosol | Nucleus | |||||
| Expt A |
27 peptides |
54 spectra |
|
0.000 0.000 | 0.000 |
0.000 0.000 | 0.000 |
0.000 0.000 | 0.000 |
0.000 0.000 | 0.004 |
0.272 0.262 | 0.280 |
0.691 0.684 | 0.697 |
0.035 0.024 | 0.042 |
0.001 0.000 | 0.005 |
| 2 spectra, YAPDENCPDQNPR | 0.000 | 0.000 | 0.027 | 0.176 | 0.098 | 0.566 | 0.133 | 0.000 | ||
| 6 spectra, SIVLLSTR | 0.000 | 0.000 | 0.000 | 0.000 | 0.408 | 0.592 | 0.000 | 0.000 | ||
| 1 spectrum, NWDPGQDSAK | 0.000 | 0.055 | 0.000 | 0.000 | 0.199 | 0.747 | 0.000 | 0.000 | ||
| 1 spectrum, HPNCVSVTK | 0.100 | 0.000 | 0.032 | 0.119 | 0.295 | 0.402 | 0.029 | 0.023 | ||
| 1 spectrum, FQSPGK | 0.000 | 0.000 | 0.000 | 0.000 | 0.272 | 0.695 | 0.033 | 0.000 | ||
| 1 spectrum, ALAQGEFYTLDGQK | 0.000 | 0.000 | 0.000 | 0.248 | 0.099 | 0.652 | 0.000 | 0.000 | ||
| 2 spectra, EYLCLDNSAR | 0.000 | 0.000 | 0.000 | 0.041 | 0.279 | 0.679 | 0.000 | 0.000 | ||
| 2 spectra, YSSAIGFLMK | 0.000 | 0.036 | 0.000 | 0.000 | 0.277 | 0.688 | 0.000 | 0.000 | ||
| 1 spectrum, YILIQDGGALHIGAEK | 0.000 | 0.000 | 0.000 | 0.000 | 0.078 | 0.657 | 0.265 | 0.000 | ||
| 2 spectra, TSWTMLAR | 0.000 | 0.045 | 0.000 | 0.000 | 0.051 | 0.568 | 0.336 | 0.000 | ||
| 3 spectra, HMGQQHLGR | 0.000 | 0.123 | 0.000 | 0.000 | 0.307 | 0.493 | 0.078 | 0.000 | ||
| 4 spectra, VIDQDTAR | 0.000 | 0.000 | 0.000 | 0.072 | 0.012 | 0.743 | 0.173 | 0.000 | ||
| 1 spectrum, IEEYEPAQSMEELQK | 0.000 | 0.008 | 0.000 | 0.000 | 0.000 | 0.992 | 0.000 | 0.000 | ||
| 2 spectra, AEVGILTR | 0.000 | 0.000 | 0.000 | 0.000 | 0.199 | 0.801 | 0.000 | 0.000 | ||
| 1 spectrum, LIQGLGYR | 0.000 | 0.000 | 0.000 | 0.000 | 0.237 | 0.763 | 0.000 | 0.000 | ||
| 2 spectra, DGHSYCSSQGCER | 0.000 | 0.000 | 0.000 | 0.172 | 0.180 | 0.572 | 0.000 | 0.076 | ||
| 5 spectra, VVPFRPAPPPK | 0.000 | 0.000 | 0.000 | 0.112 | 0.326 | 0.556 | 0.000 | 0.005 | ||
| 2 spectra, VHSNFK | 0.003 | 0.050 | 0.000 | 0.000 | 0.133 | 0.643 | 0.171 | 0.000 | ||
| 4 spectra, DEYPSHPMVLR | 0.000 | 0.082 | 0.000 | 0.000 | 0.067 | 0.619 | 0.231 | 0.000 | ||
| 2 spectra, LHLLDDVSSWGAGDR | 0.120 | 0.000 | 0.000 | 0.102 | 0.000 | 0.779 | 0.000 | 0.000 | ||
| 1 spectrum, AISPQYQPVVMLEK | 0.000 | 0.000 | 0.028 | 0.000 | 0.163 | 0.650 | 0.159 | 0.000 | ||
| 2 spectra, NYGSQGGQNK | 0.000 | 0.000 | 0.021 | 0.022 | 0.000 | 0.752 | 0.205 | 0.000 | ||
| 2 spectra, ATITLYGK | 0.000 | 0.032 | 0.000 | 0.000 | 0.404 | 0.461 | 0.103 | 0.000 | ||
| 1 spectrum, AYPQYYK | 0.000 | 0.000 | 0.000 | 0.000 | 0.355 | 0.641 | 0.000 | 0.004 | ||
| 1 spectrum, FRPHQDADPEKPR | 0.000 | 0.073 | 0.113 | 0.000 | 0.000 | 0.491 | 0.323 | 0.000 | ||
| 1 spectrum, TTFLYLVNFNK | 0.000 | 0.000 | 0.000 | 0.113 | 0.146 | 0.741 | 0.000 | 0.000 | ||
| 1 spectrum, DTIGFDTLGHCFFLEDGVEQR | 0.085 | 0.000 | 0.000 | 0.310 | 0.283 | 0.293 | 0.000 | 0.029 |
| Plot | Mito | Lyso or Perox | ER | Golgi | PM | Cytosol | Nucleus | ||||||
| Expt B |
3 peptides |
4 spectra |
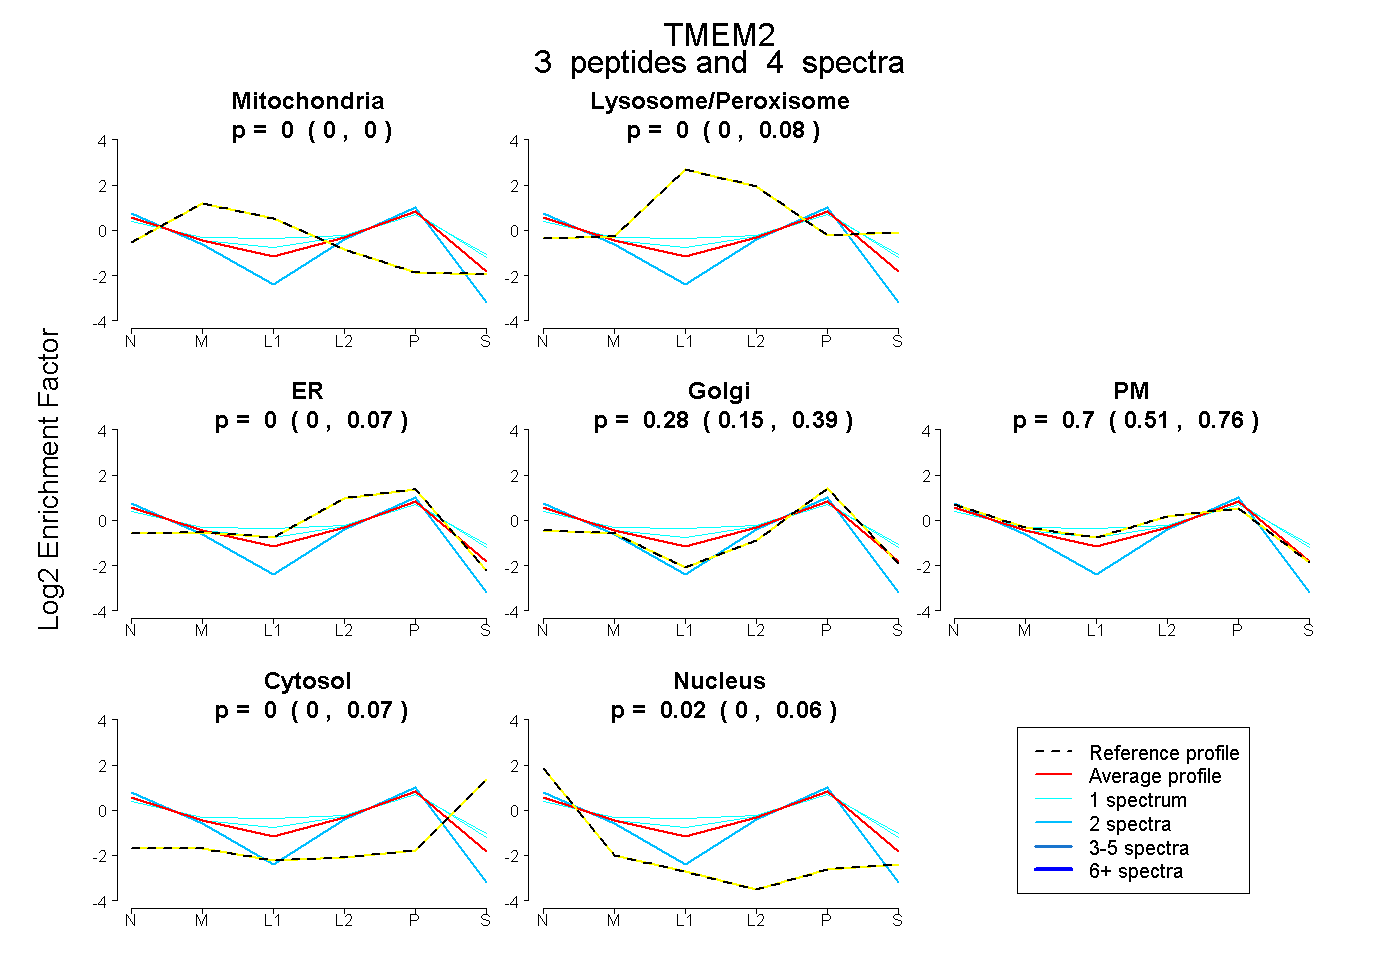 |
0.000 0.000 | 0.000 |
0.000 0.000 | 0.076 |
0.000 0.000 | 0.072 |
0.279 0.152 | 0.390 |
0.696 0.509 | 0.764 |
0.000 0.000 | 0.075 |
0.025 0.000 | 0.060 |
|||
| Plot | Lyso | Other | |||||||||||
| Expt C |
30 peptides |
72 spectra |
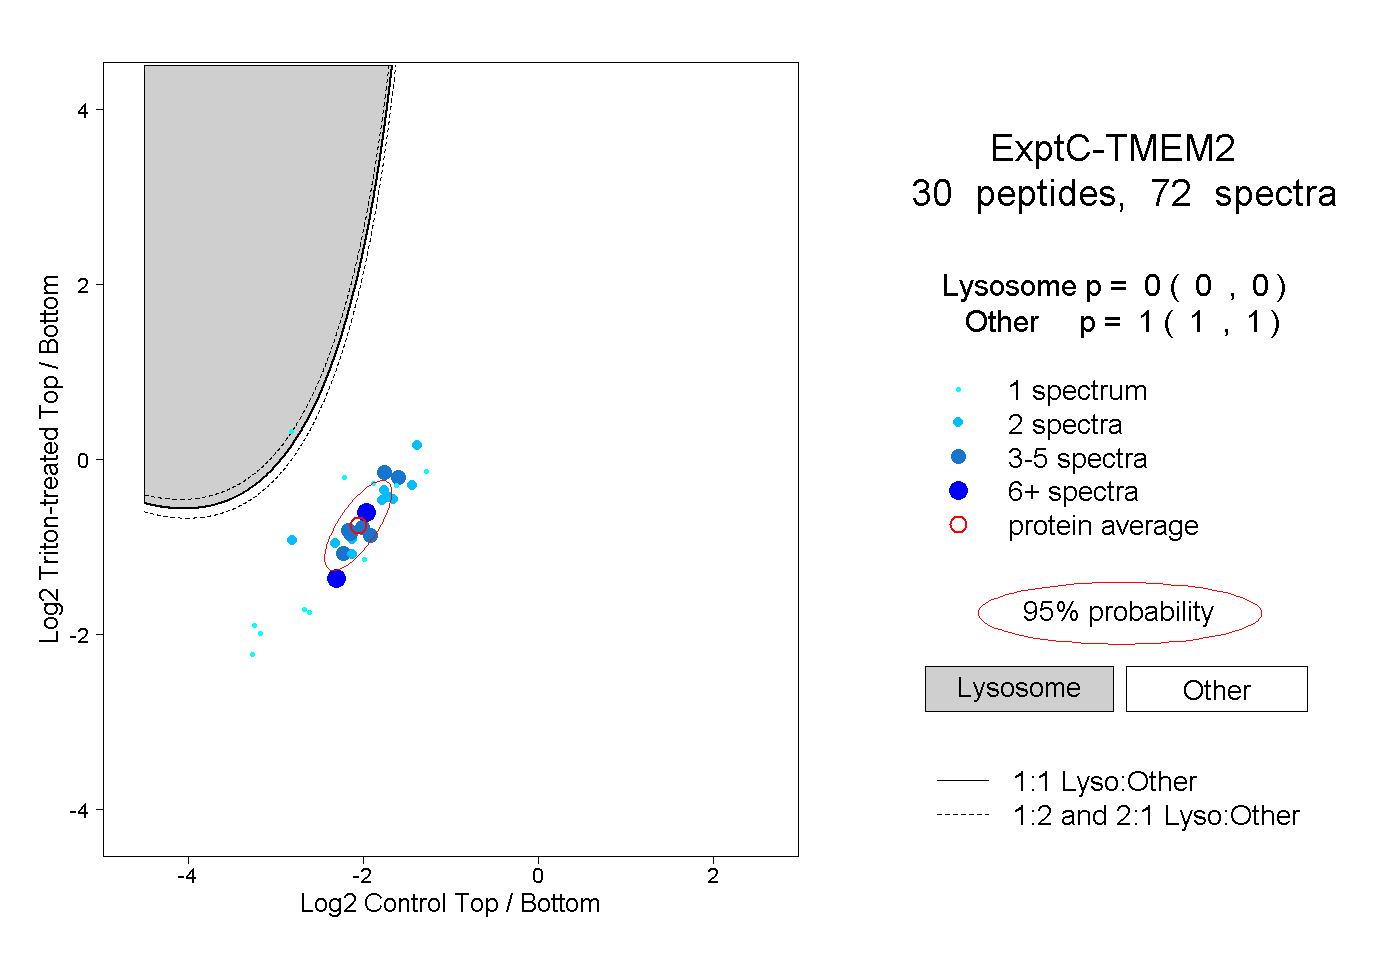 |
0.000 0.000 | 0.000 |
1.000 1.000 | 1.000 |
||||||||
| Plot | Lyso | Other | |||||||||||
| Expt D |
3 peptides |
5 spectra |
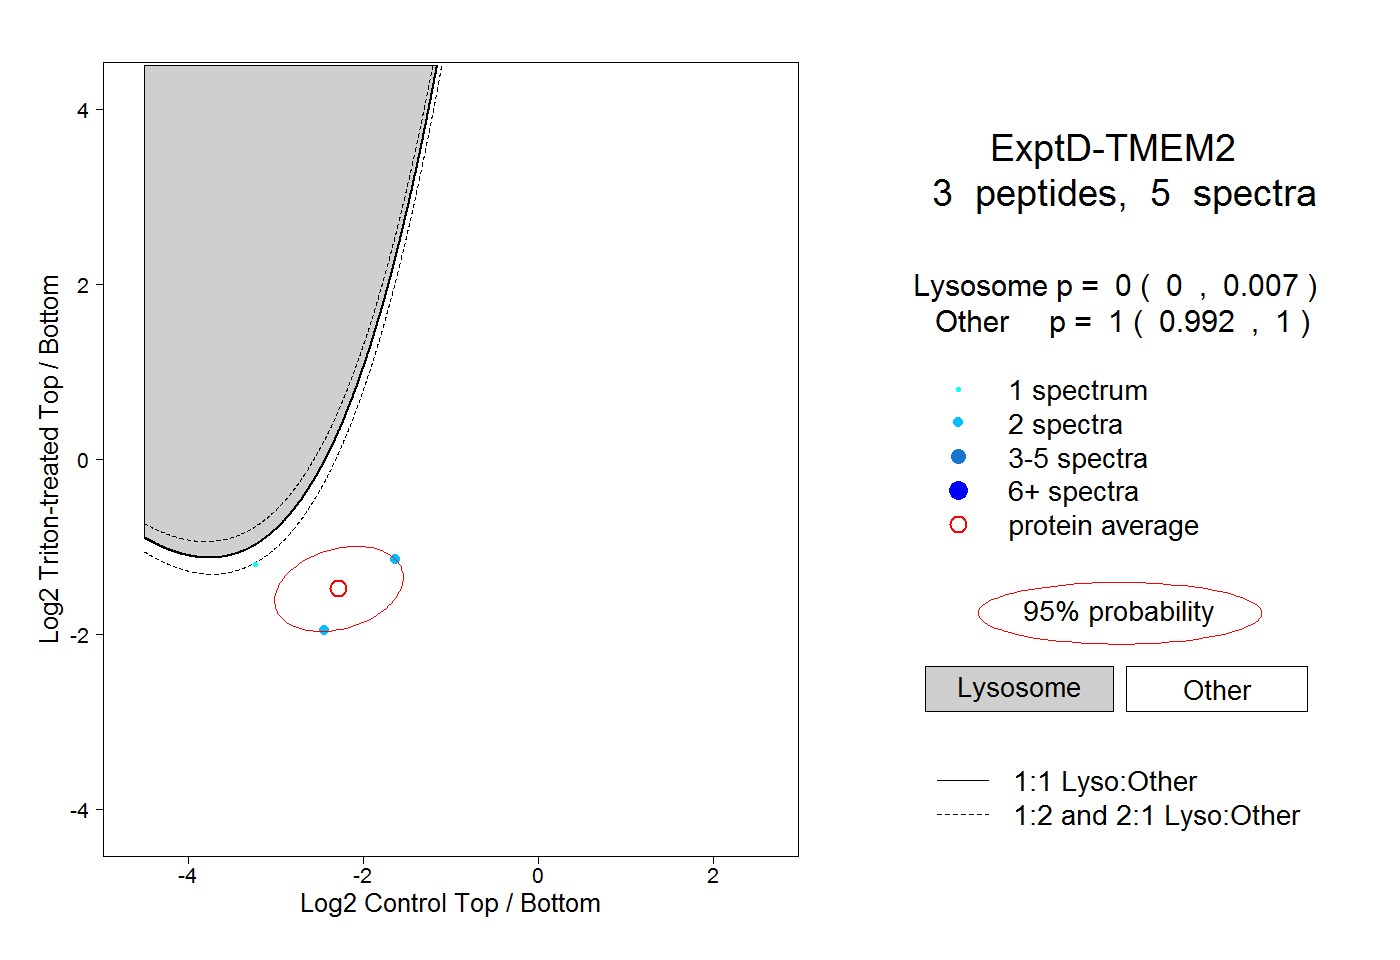 |
0.000 0.000 | 0.007 |
1.000 0.992 | 1.000 |