 22
22peptides
spectra
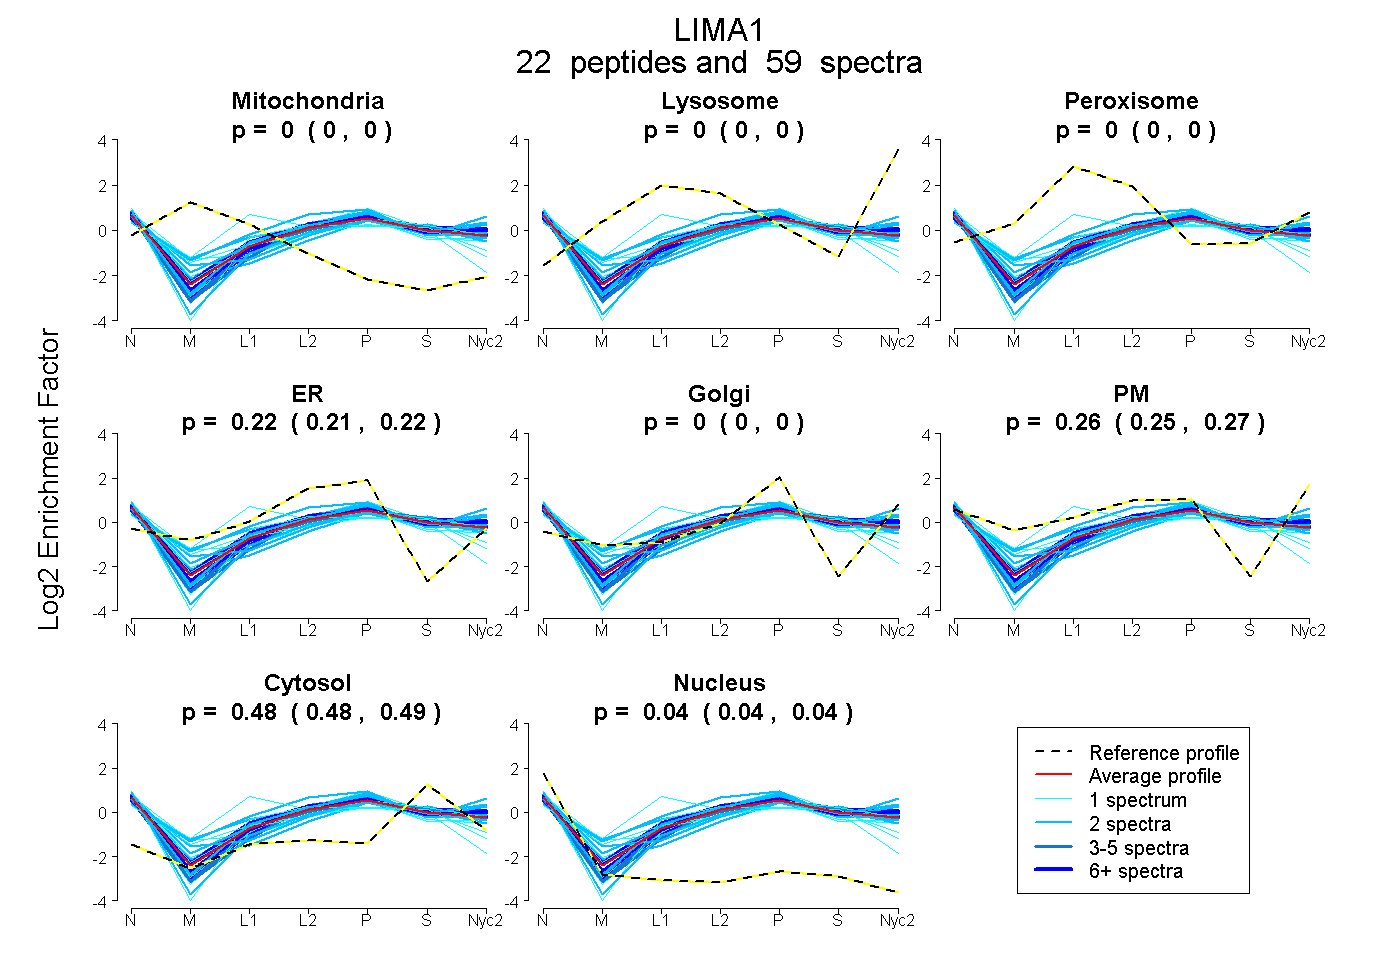
0.000 | 0.000
0.000 | 0.000
0.000 | 0.000
0.208 | 0.223
0.000 | 0.000
0.252 | 0.270
0.481 | 0.485
0.037 | 0.041
7peptides
spectra
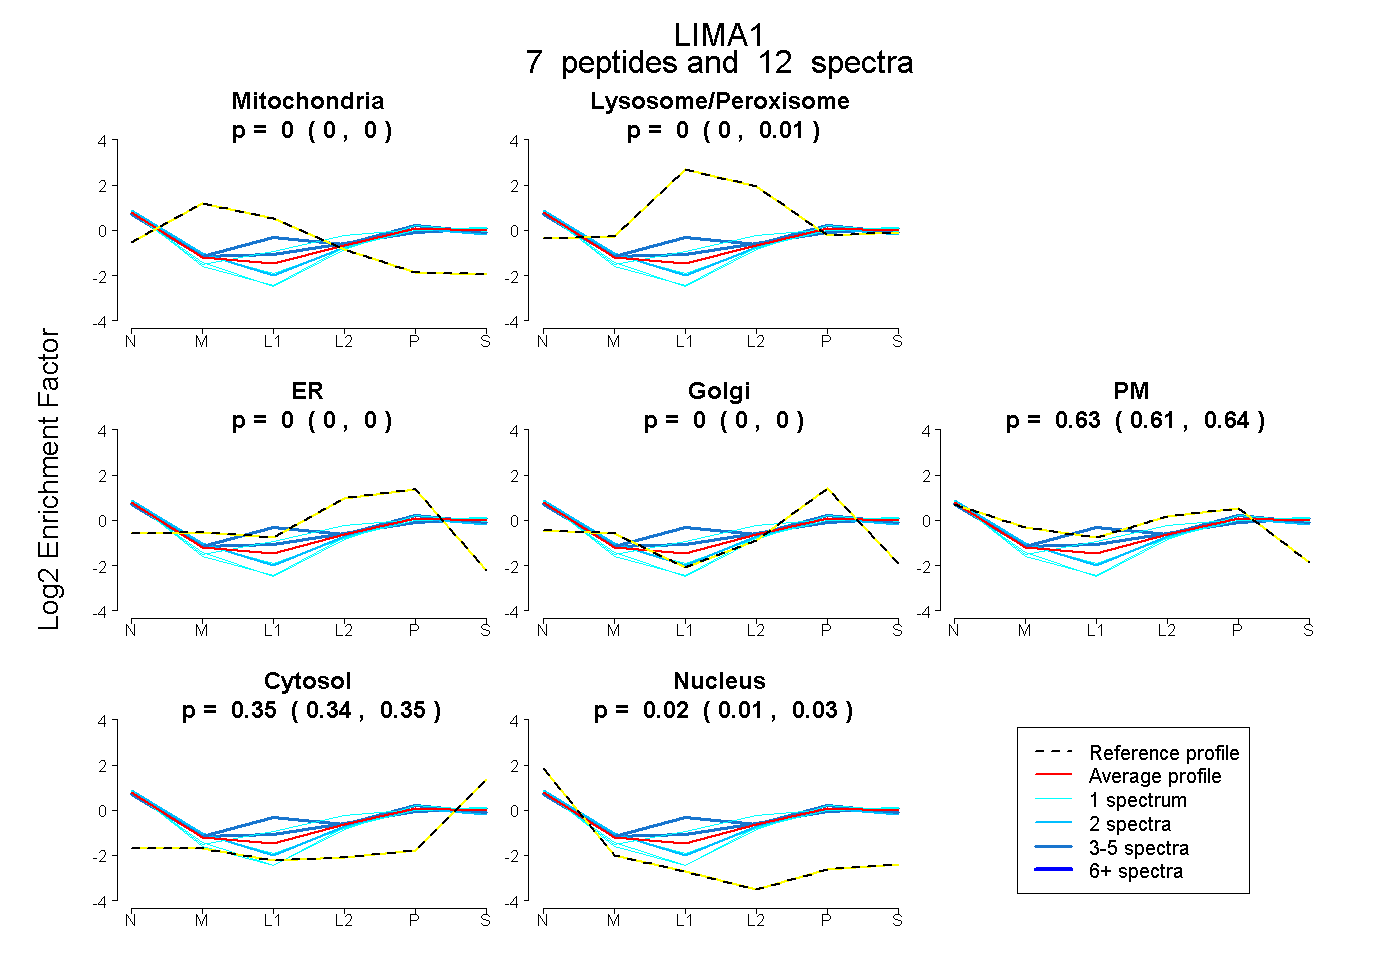
0.000 | 0.000
0.000 | 0.007
0.000 | 0.000
0.000 | 0.000
0.612 | 0.639
0.337 | 0.353
0.014 | 0.034
24peptides
spectra
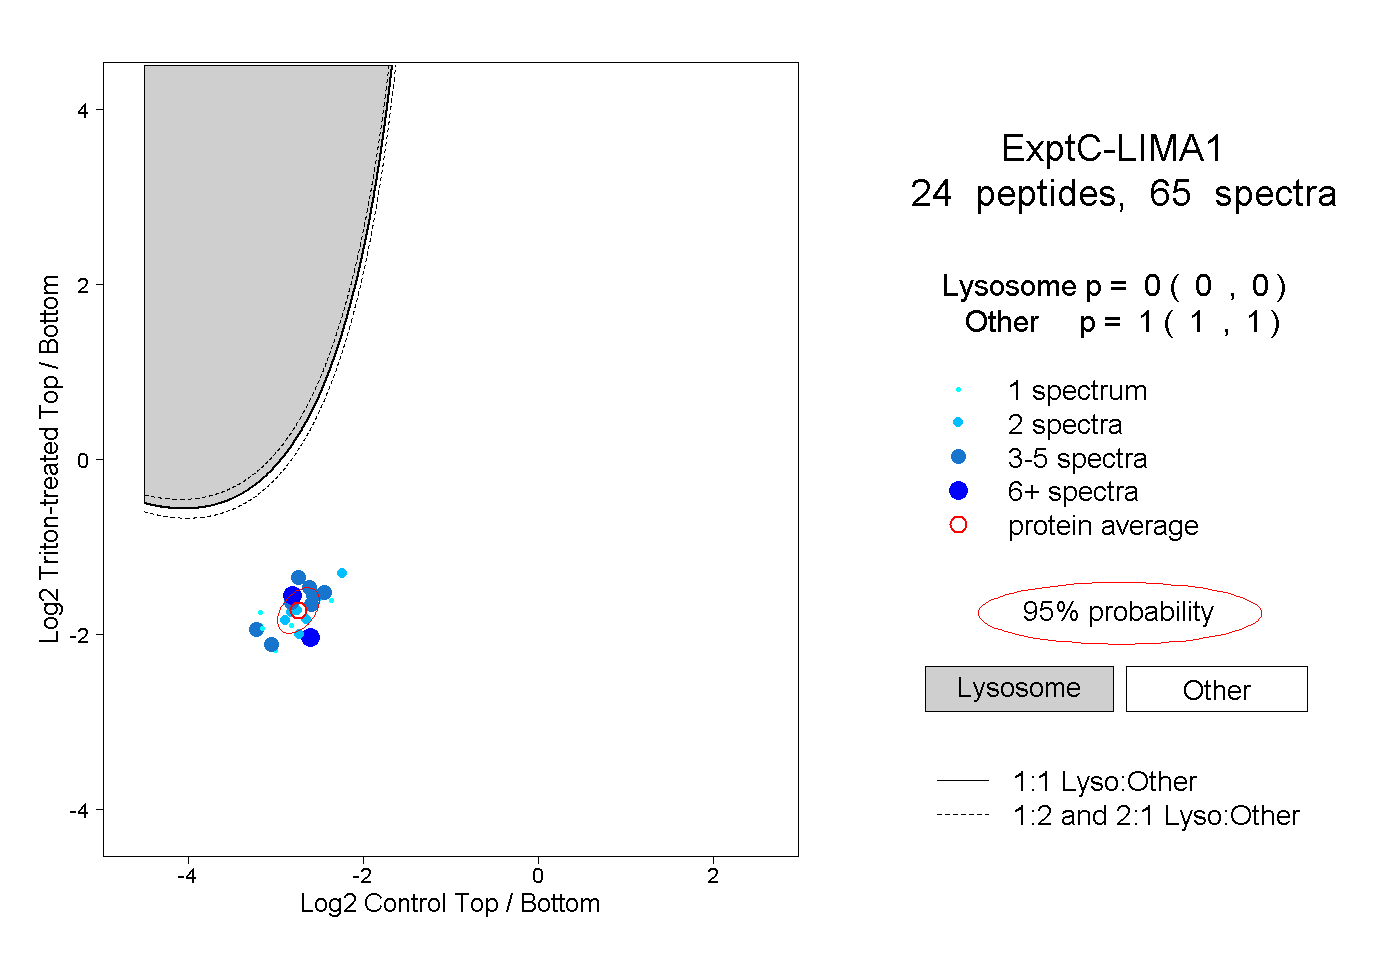
0.000 | 0.000
1.000 | 1.000
5peptides
spectra
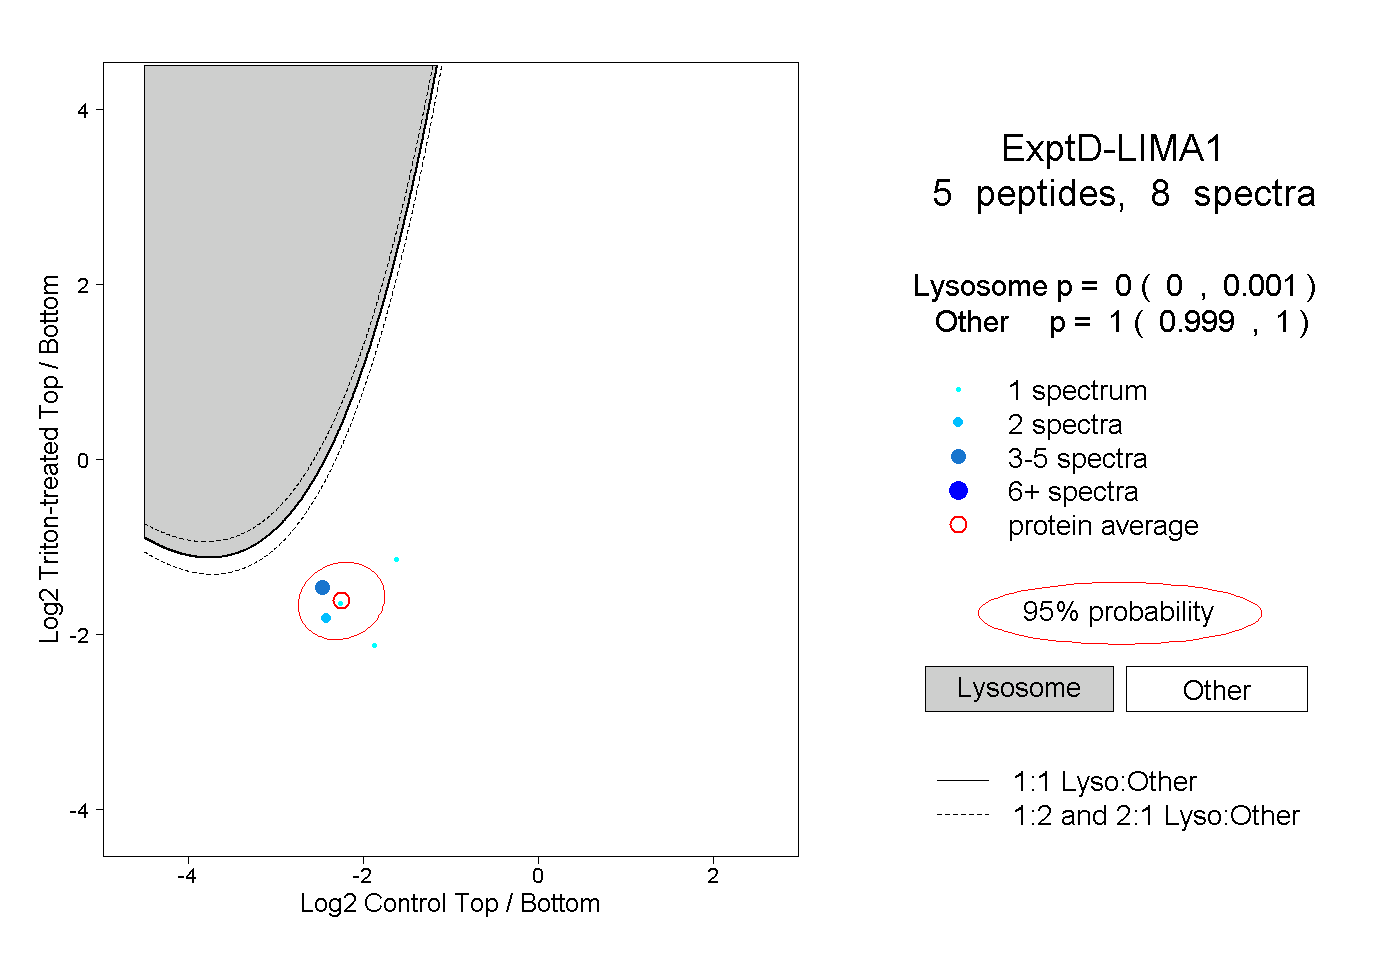
0.000 | 0.001
0.999 | 1.000