LIMA1
[ENSRNOP00000063172]
Main page
| | | Plot |
Mito |
Lyso |
|
Perox |
ER |
Golgi |
PM |
Cytosol |
Nucleus |
|
| Expt A |
 22
22
peptides |
59
spectra |
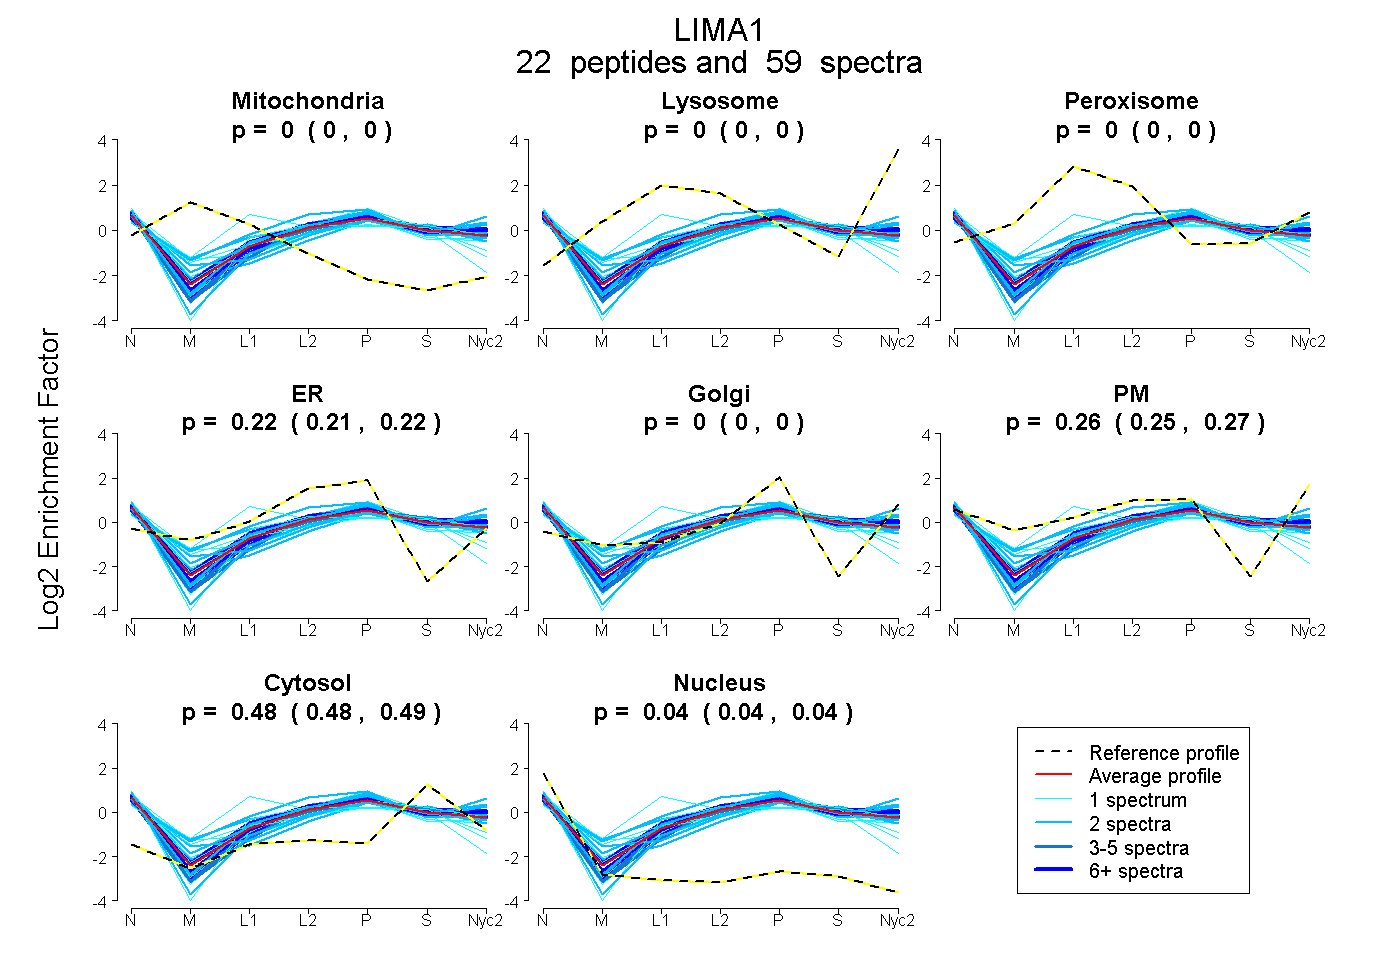 |
0.000
0.000 | 0.000 |
0.000
0.000 | 0.000 |
|
0.000
0.000 | 0.000 |
0.217
0.208 | 0.223 |
0.000
0.000 | 0.000 |
0.261
0.252 | 0.270 |
0.483
0.481 | 0.485 |
0.039
0.037 | 0.041 |
|
| | | Plot |
Mito |
|
Lyso or Perox |
|
ER |
Golgi |
PM |
Cytosol |
Nucleus |
|
| Expt B |
7
peptides |
12
spectra |
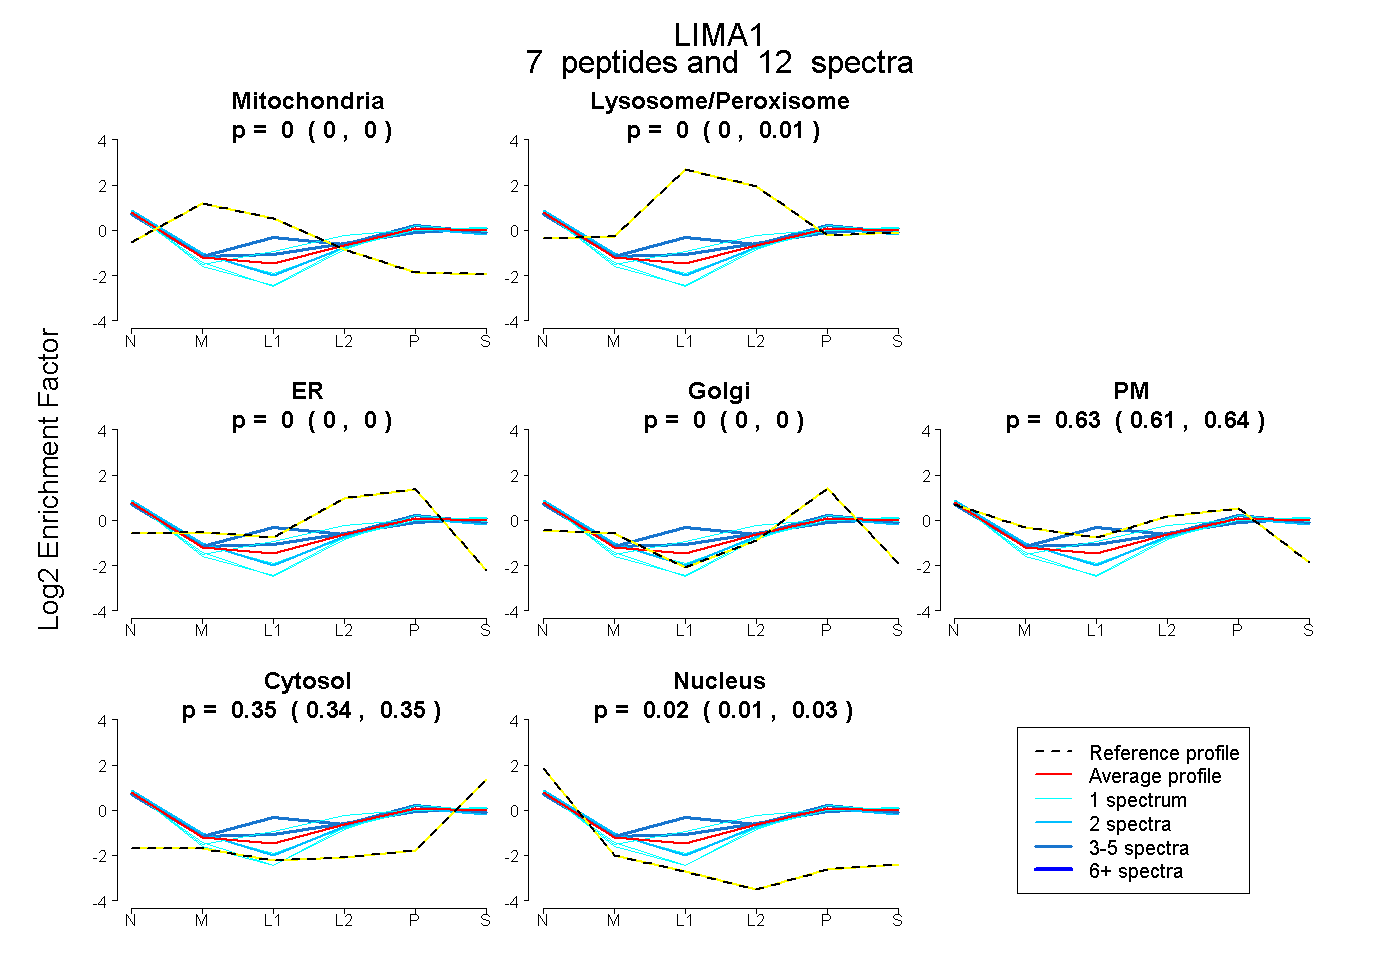 |
0.000
0.000 | 0.000 |
|
0.000
0.000 | 0.007 |
|
0.000
0.000 | 0.000 |
0.000
0.000 | 0.000 |
0.629
0.612 | 0.639 |
0.347
0.337 | 0.353 |
0.024
0.014 | 0.034 |
|
| 2 spectra, NLELPR |
0.000 |
|
0.000 |
|
0.000 |
0.055 |
0.562 |
0.302 |
0.081 |
|
| 1 spectrum, YNVPLNR |
0.000 |
|
0.000 |
|
0.000 |
0.222 |
0.356 |
0.324 |
0.098 |
|
| 3 spectra, SRPFTVAASFR |
0.000 |
|
0.214 |
|
0.000 |
0.000 |
0.472 |
0.239 |
0.075 |
|
| 3 spectra, FGSRPEAVTQCR |
0.000 |
|
0.091 |
|
0.000 |
0.000 |
0.528 |
0.330 |
0.051 |
|
| 1 spectrum, AAEEANMER |
0.000 |
|
0.000 |
|
0.000 |
0.034 |
0.555 |
0.363 |
0.048 |
|
| 1 spectrum, YQAAVSK |
0.000 |
|
0.141 |
|
0.000 |
0.000 |
0.511 |
0.304 |
0.044 |
|
| 1 spectrum, SSTIVEIFSK |
0.000 |
|
0.000 |
|
0.000 |
0.112 |
0.418 |
0.360 |
0.110 |
|
| | | Plot |
|
Lyso |
|
|
|
|
|
|
|
Other |
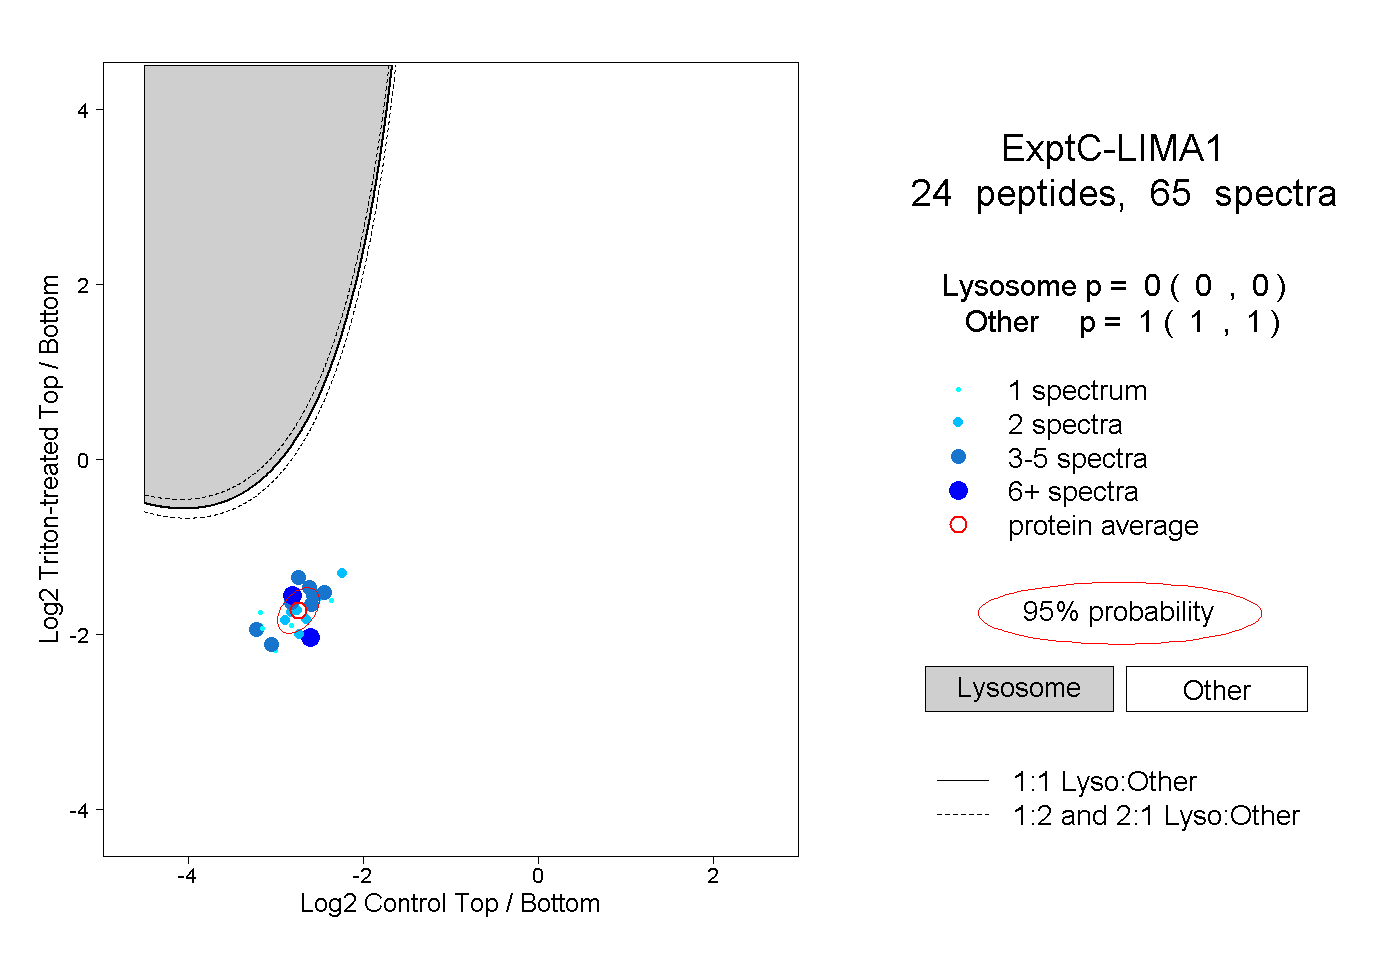
| Expt C |
24
peptides |
65
spectra |
 |
|
0.000
0.000 | 0.000 |
|
|
|
|
|
|
|
1.000
1.000 | 1.000 |
| | | Plot |
|
Lyso |
|
|
|
|
|
|
|
Other |
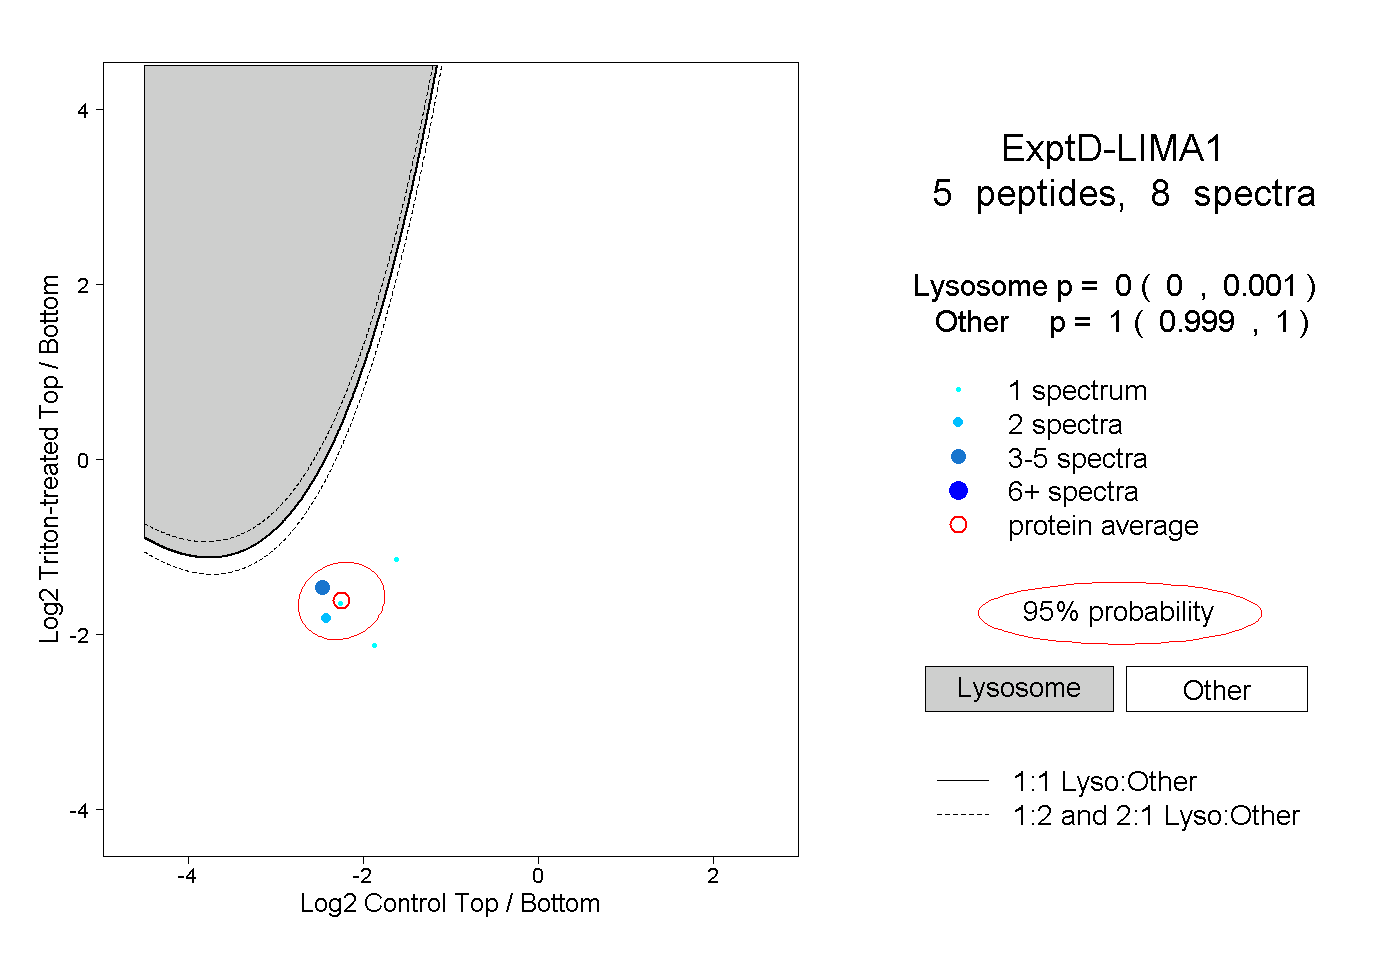
| Expt D |
5
peptides |
8
spectra |
 |
|
0.000
0.000 | 0.001 |
|
|
|
|
|
|
|
1.000
0.999 | 1.000 |