 10
10peptides
spectra
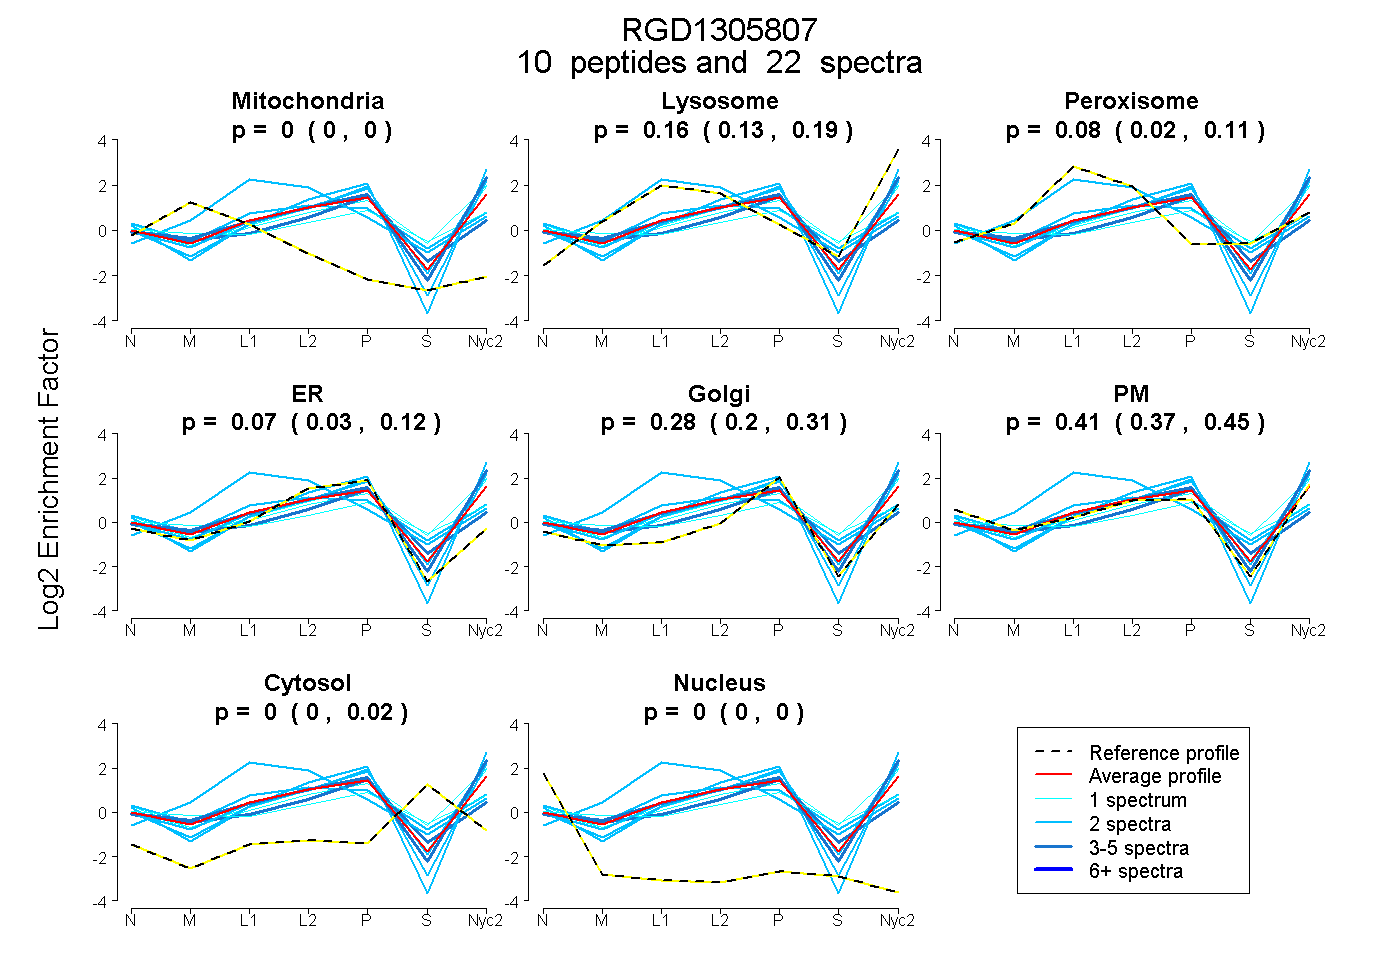
0.000 | 0.000
0.131 | 0.190
0.024 | 0.111
0.032 | 0.124
0.200 | 0.308
0.371 | 0.451
0.000 | 0.017
0.000 | 0.000
4peptides
spectra
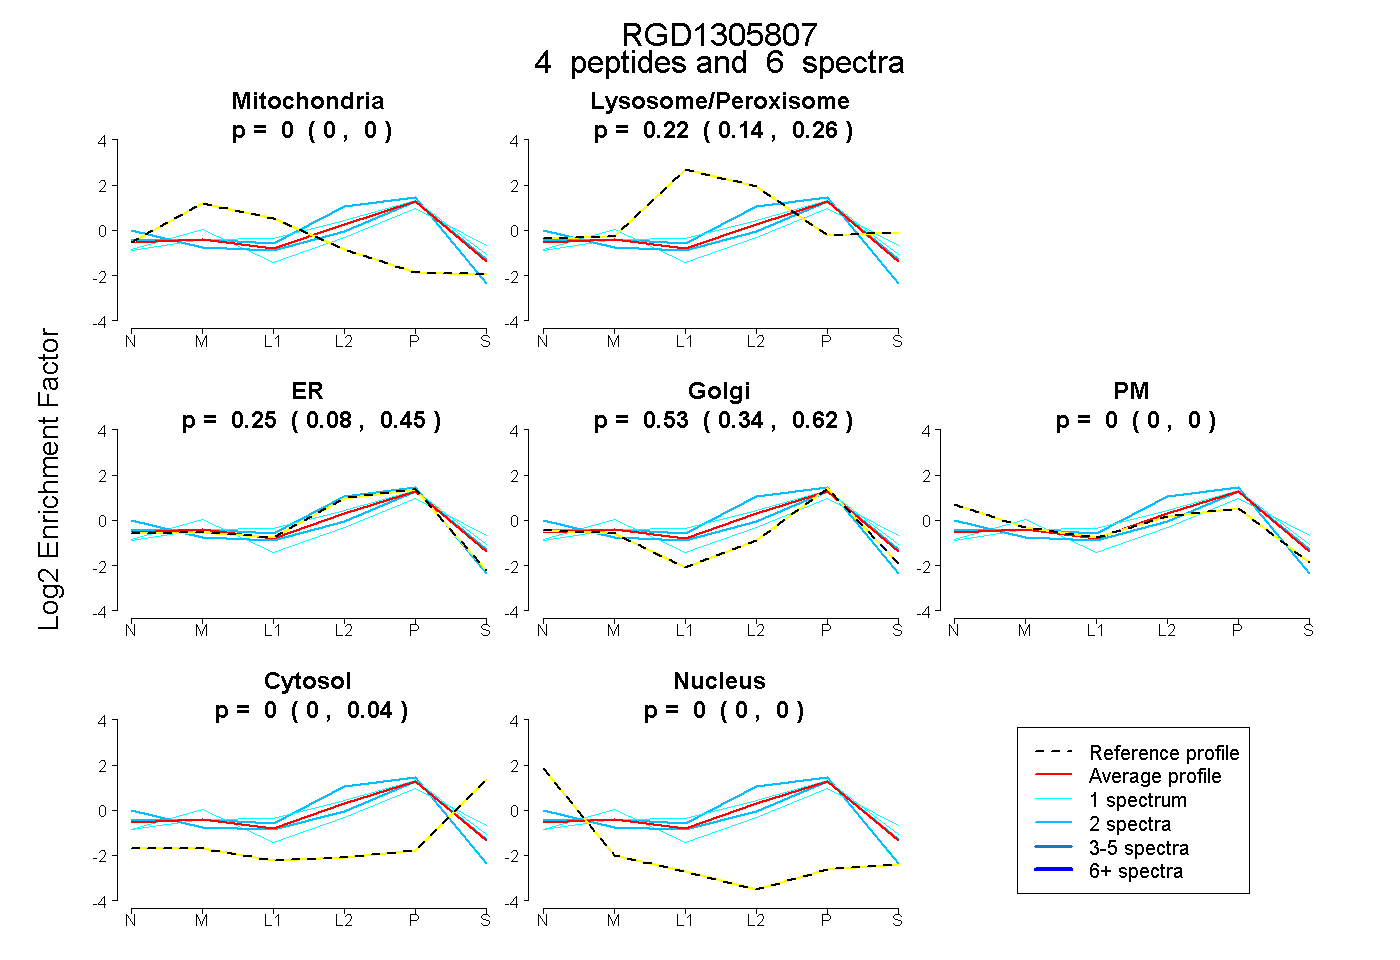
0.000 | 0.000
0.140 | 0.260
0.078 | 0.450
0.343 | 0.618
0.000 | 0.000
0.000 | 0.040
0.000 | 0.000
7peptides
spectra
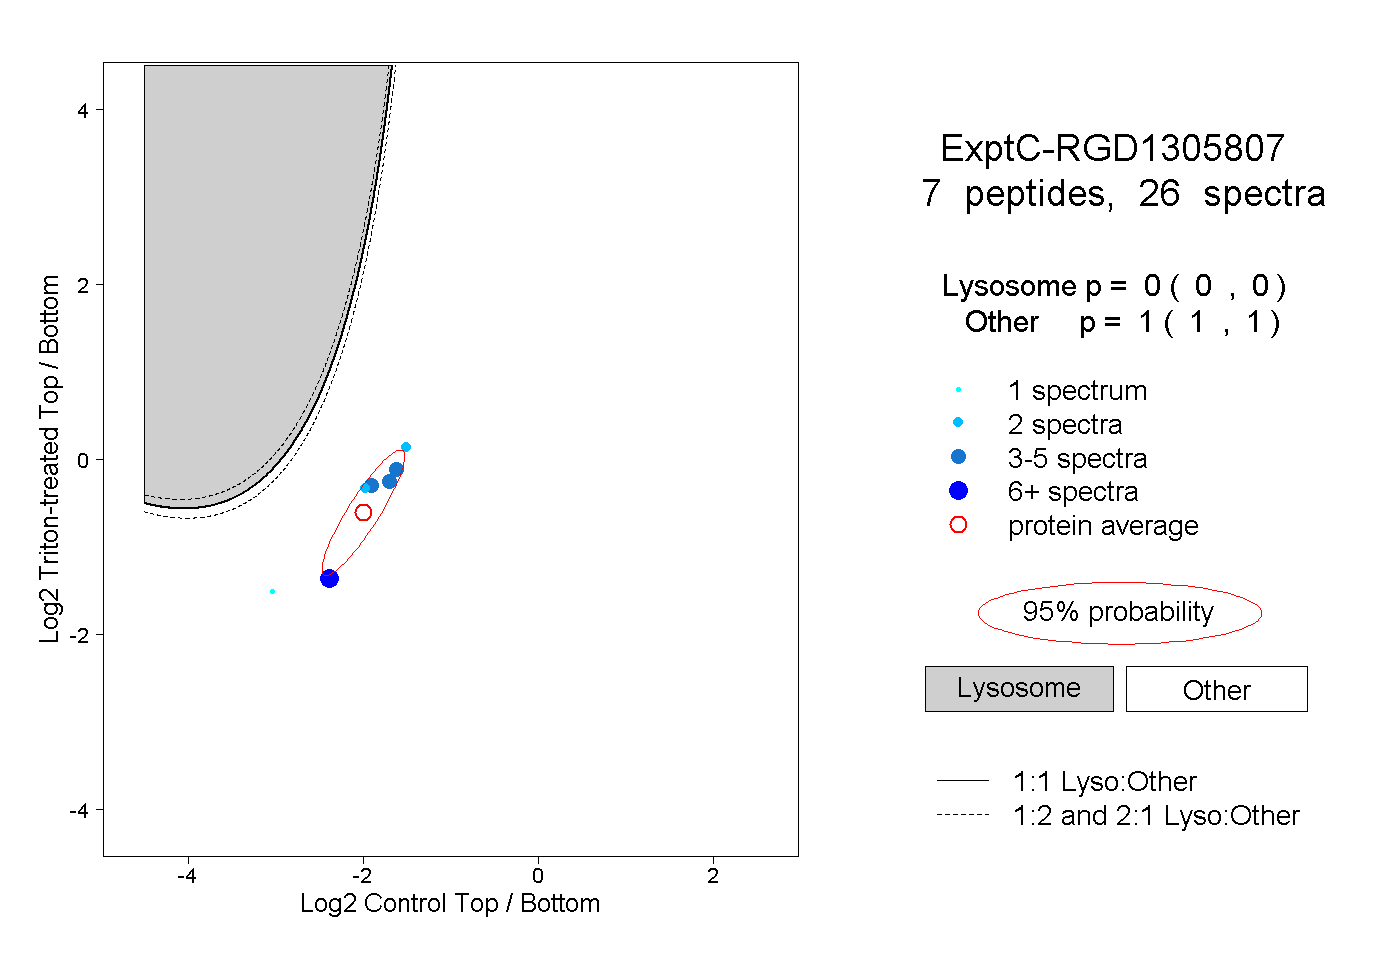
0.000 | 0.000
1.000 | 1.000
1peptide
spectra
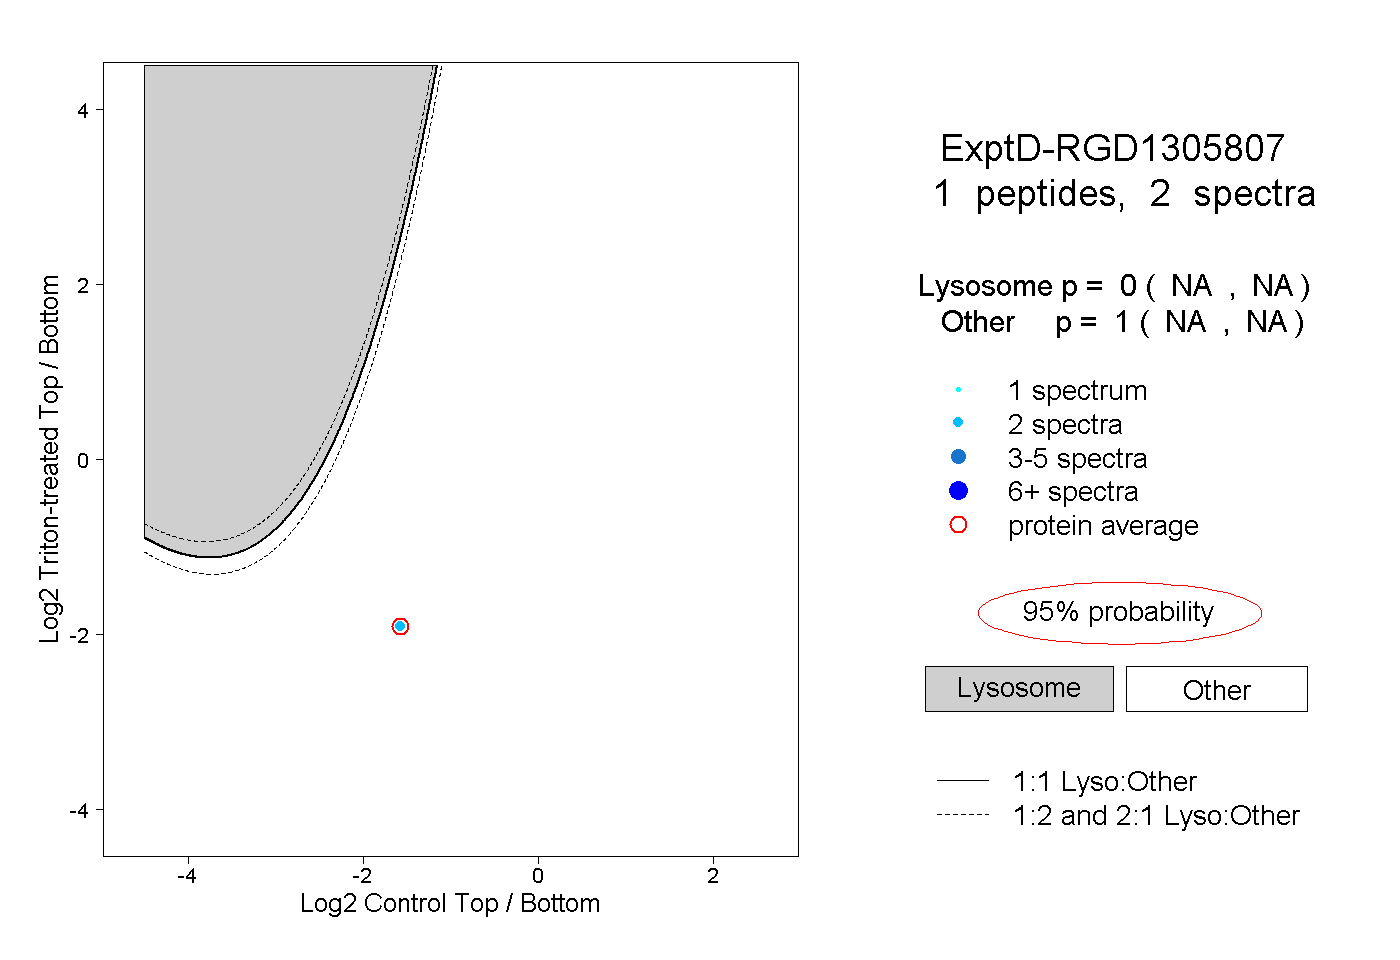
NA | NA
NA | NA