RGD1305807
[ENSRNOP00000062894]
Main page
| | | Plot |
Mito |
Lyso |
|
Perox |
ER |
Golgi |
PM |
Cytosol |
Nucleus |
|
| Expt A |
 10
10
peptides |
22
spectra |
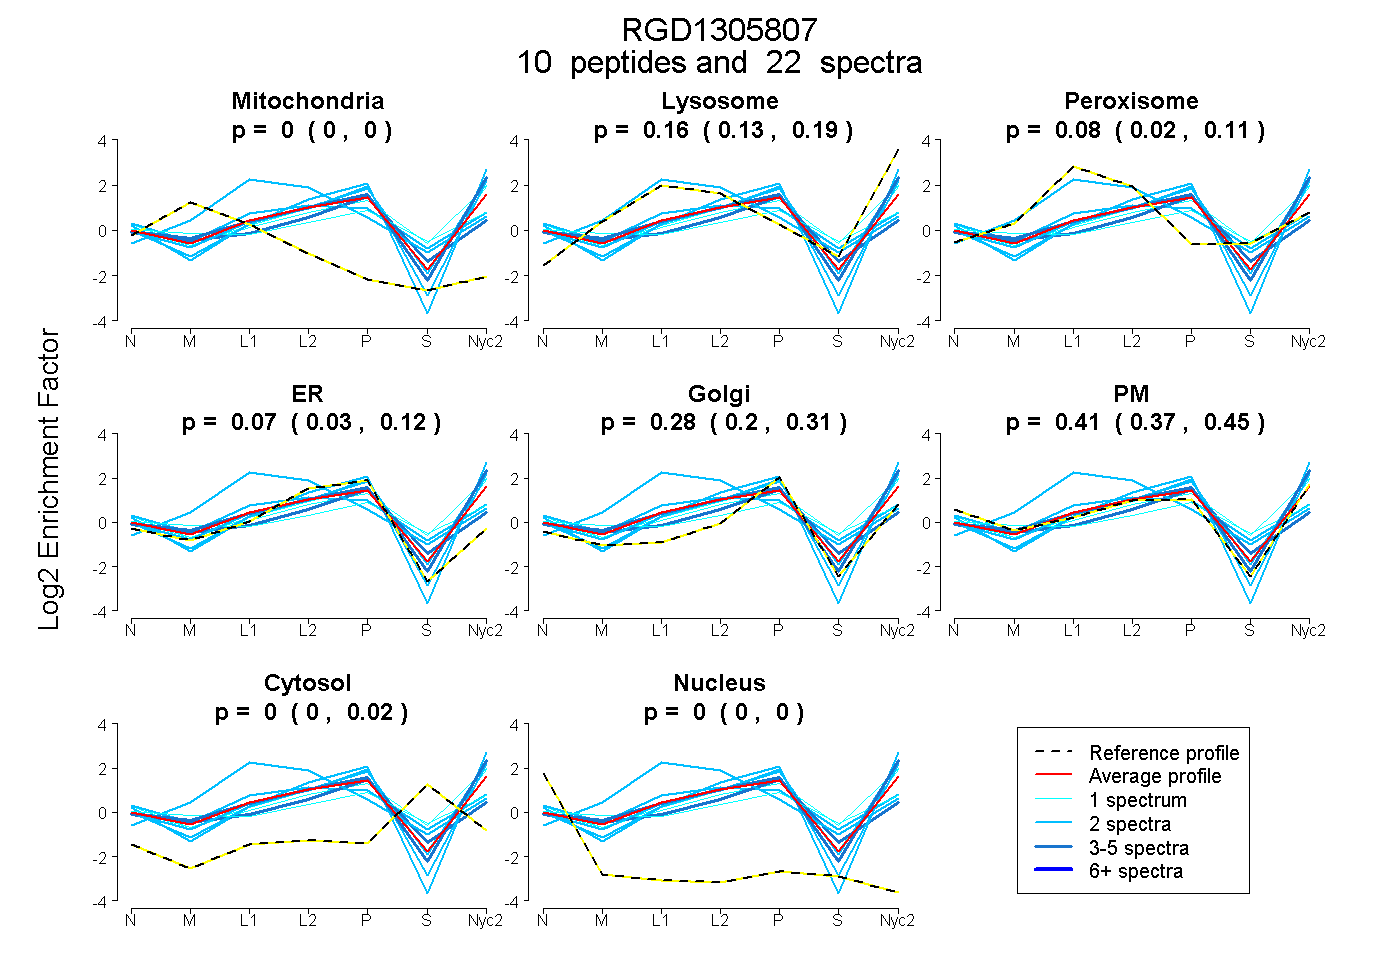 |
0.000
0.000 | 0.000 |
0.159
0.131 | 0.190 |
|
0.081
0.024 | 0.111 |
0.074
0.032 | 0.124 |
0.277
0.200 | 0.308 |
0.410
0.371 | 0.451 |
0.000
0.000 | 0.017 |
0.000
0.000 | 0.000 |
|
| | | Plot |
Mito |
|
Lyso or Perox |
|
ER |
Golgi |
PM |
Cytosol |
Nucleus |
|
| Expt B |
4
peptides |
6
spectra |
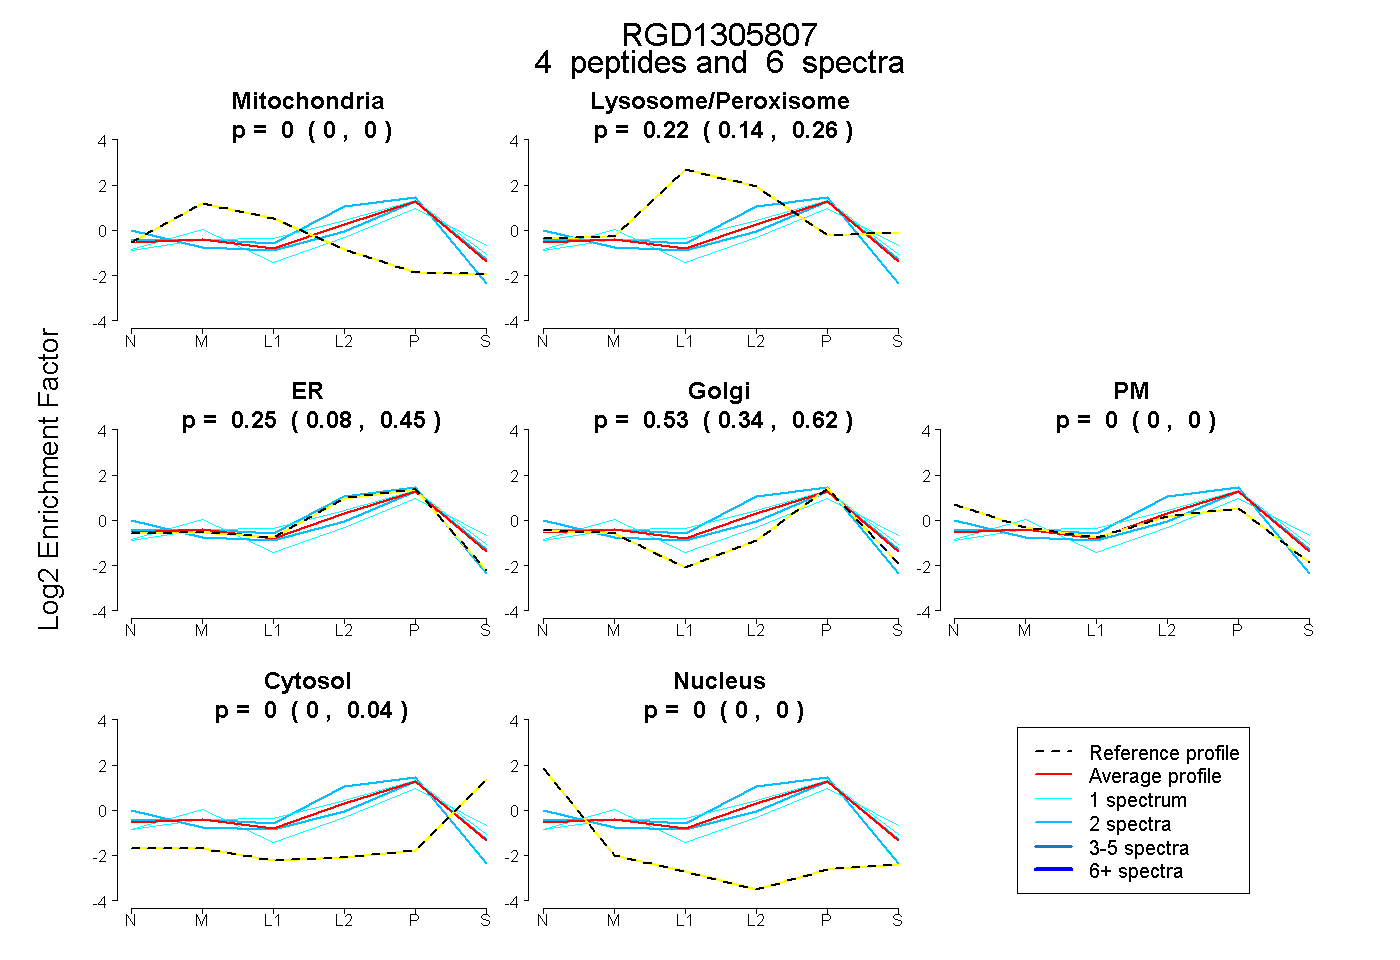 |
0.000
0.000 | 0.000 |
|
0.216
0.140 | 0.260 |
|
0.250
0.078 | 0.450 |
0.534
0.343 | 0.618 |
0.000
0.000 | 0.000 |
0.000
0.000 | 0.040 |
0.000
0.000 | 0.000 |
|
| 1 spectrum, SLLEAHQEK |
0.000 |
|
0.192 |
|
0.000 |
0.677 |
0.000 |
0.131 |
0.000 |
|
| 2 spectra, SWFQTR |
0.000 |
|
0.212 |
|
0.012 |
0.631 |
0.145 |
0.000 |
0.000 |
|
| 1 spectrum, MLAASAR |
0.000 |
|
0.284 |
|
0.265 |
0.429 |
0.000 |
0.021 |
0.000 |
|
| 2 spectra, AASAR |
0.000 |
|
0.017 |
|
0.983 |
0.000 |
0.000 |
0.000 |
0.000 |
|
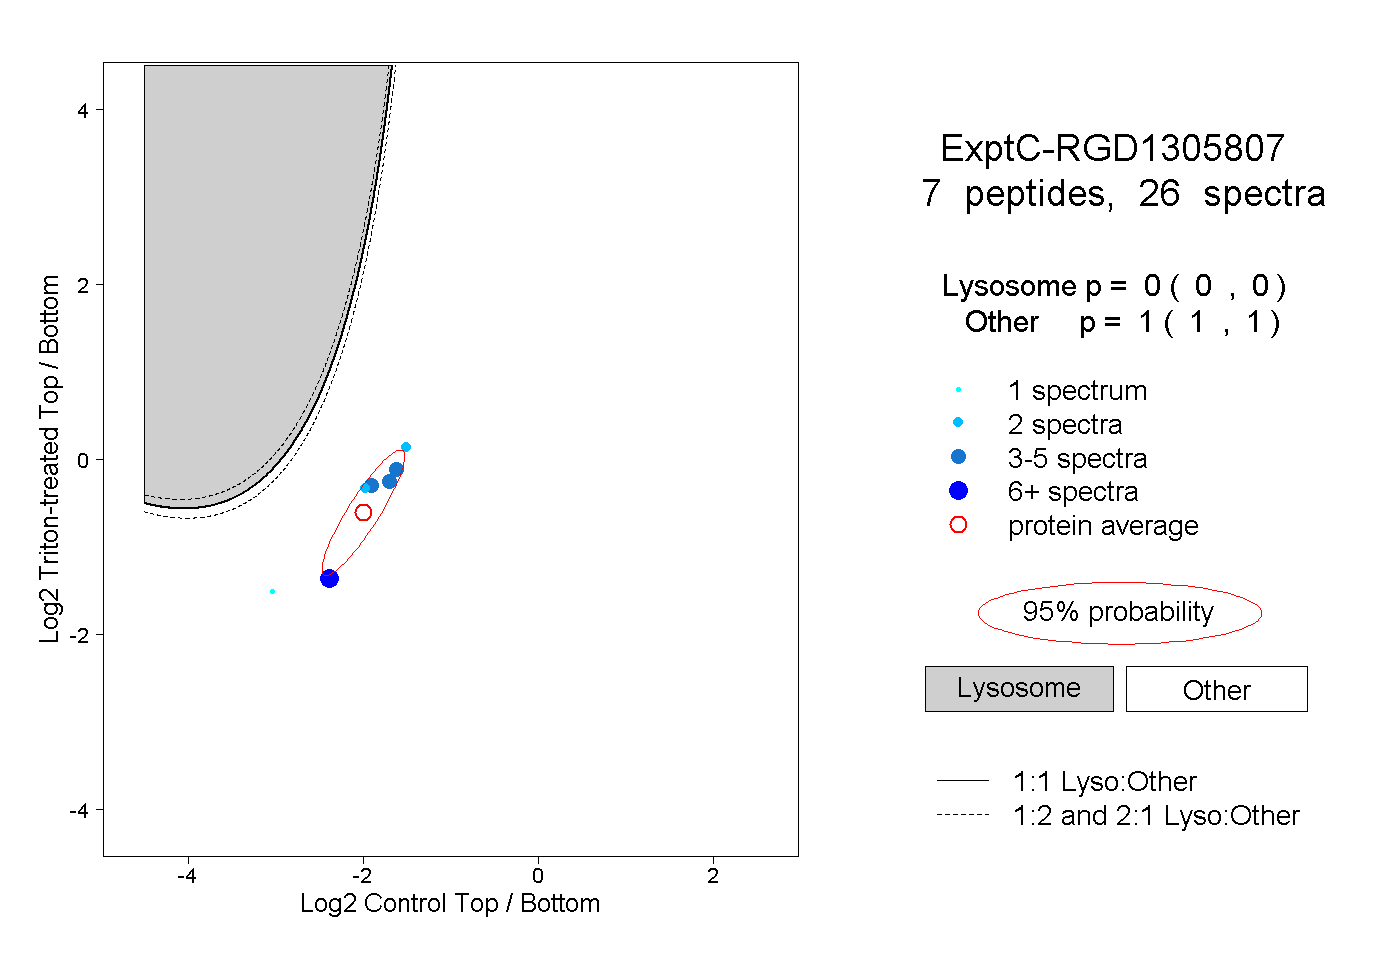
| | | Plot |
|
Lyso |
|
|
|
|
|
|
|
Other |
| Expt C |
7
peptides |
26
spectra |
 |
|
0.000
0.000 | 0.000 |
|
|
|
|
|
|
|
1.000
1.000 | 1.000 |
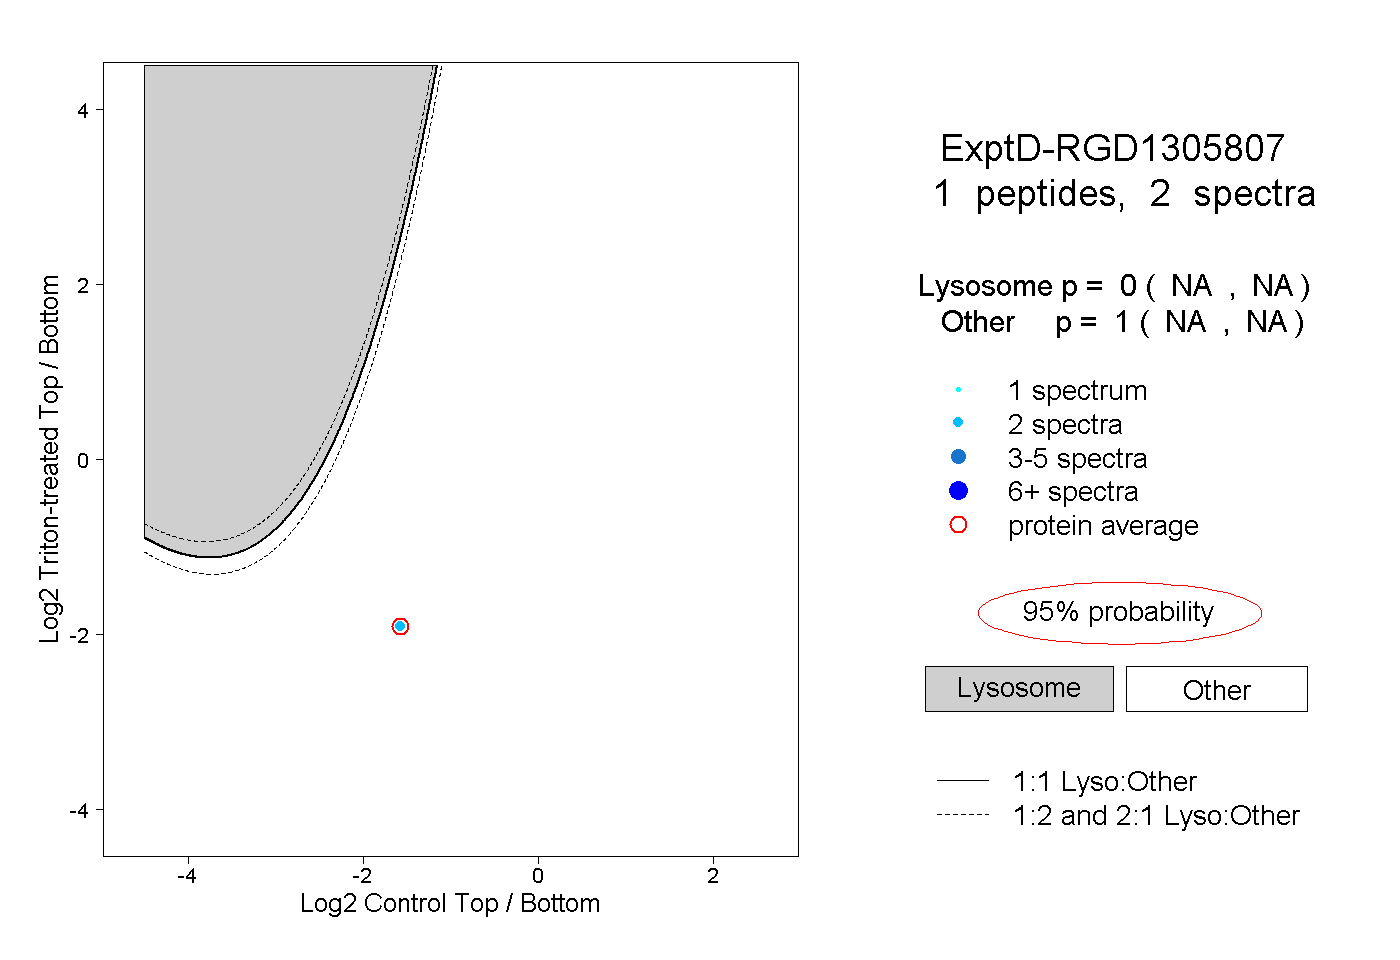
| | | Plot |
|
Lyso |
|
|
|
|
|
|
|
Other |
| Expt D |
1
peptide |
2
spectra |
 |
|
0.000
NA | NA |
|
|
|
|
|
|
|
1.000
NA | NA |