 10
10peptides
spectra
0.000 | 0.000
0.131 | 0.190
0.024 | 0.111
0.032 | 0.124
0.200 | 0.308
0.371 | 0.451
0.000 | 0.017
0.000 | 0.000
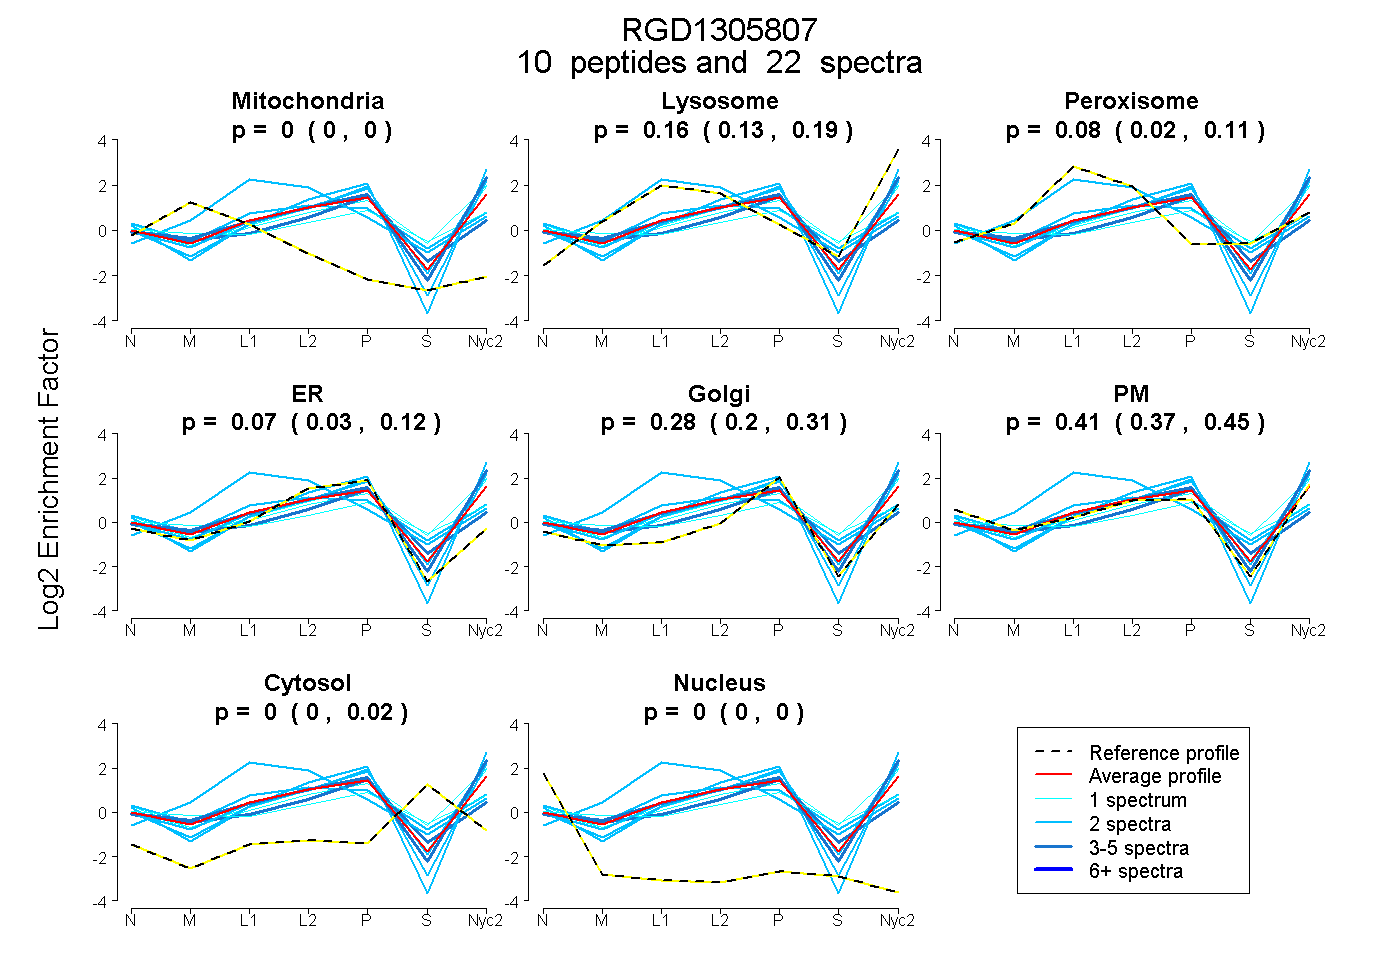
| Plot | Mito | Lyso | Perox | ER | Golgi | PM | Cytosol | Nucleus | |||||
| Expt A |
10 peptides |
22 spectra |
|
0.000 0.000 | 0.000 |
0.159 0.131 | 0.190 |
0.081 0.024 | 0.111 |
0.074 0.032 | 0.124 |
0.277 0.200 | 0.308 |
0.410 0.371 | 0.451 |
0.000 0.000 | 0.017 |
0.000 0.000 | 0.000 |
| 2 spectra, SLLEAHQEK | 0.000 | 0.142 | 0.000 | 0.015 | 0.281 | 0.562 | 0.000 | 0.000 | ||
| 1 spectrum, SHSPSSAASVVAIAR | 0.000 | 0.003 | 0.191 | 0.000 | 0.243 | 0.344 | 0.219 | 0.000 | ||
| 2 spectra, MLSAAAR | 0.000 | 0.068 | 0.679 | 0.253 | 0.000 | 0.000 | 0.000 | 0.000 | ||
| 4 spectra, SWFQTR | 0.000 | 0.236 | 0.000 | 0.000 | 0.208 | 0.555 | 0.000 | 0.000 | ||
| 2 spectra, FLHMFFK | 0.000 | 0.170 | 0.000 | 0.000 | 0.315 | 0.515 | 0.000 | 0.000 | ||
| 2 spectra, QKPLALNNR | 0.000 | 0.071 | 0.000 | 0.000 | 0.175 | 0.754 | 0.000 | 0.000 | ||
| 2 spectra, HGCPNQSAGPR | 0.000 | 0.000 | 0.302 | 0.133 | 0.036 | 0.410 | 0.118 | 0.000 | ||
| 1 spectrum, LWAGDK | 0.000 | 0.273 | 0.000 | 0.000 | 0.157 | 0.416 | 0.155 | 0.000 | ||
| 1 spectrum, ALPVHLGLESQTEEK | 0.000 | 0.156 | 0.000 | 0.000 | 0.245 | 0.595 | 0.004 | 0.000 | ||
| 5 spectra, MLAASAR | 0.000 | 0.000 | 0.189 | 0.169 | 0.496 | 0.069 | 0.077 | 0.000 |
| Plot | Mito | Lyso or Perox | ER | Golgi | PM | Cytosol | Nucleus | ||||||
| Expt B |
4 peptides |
6 spectra |
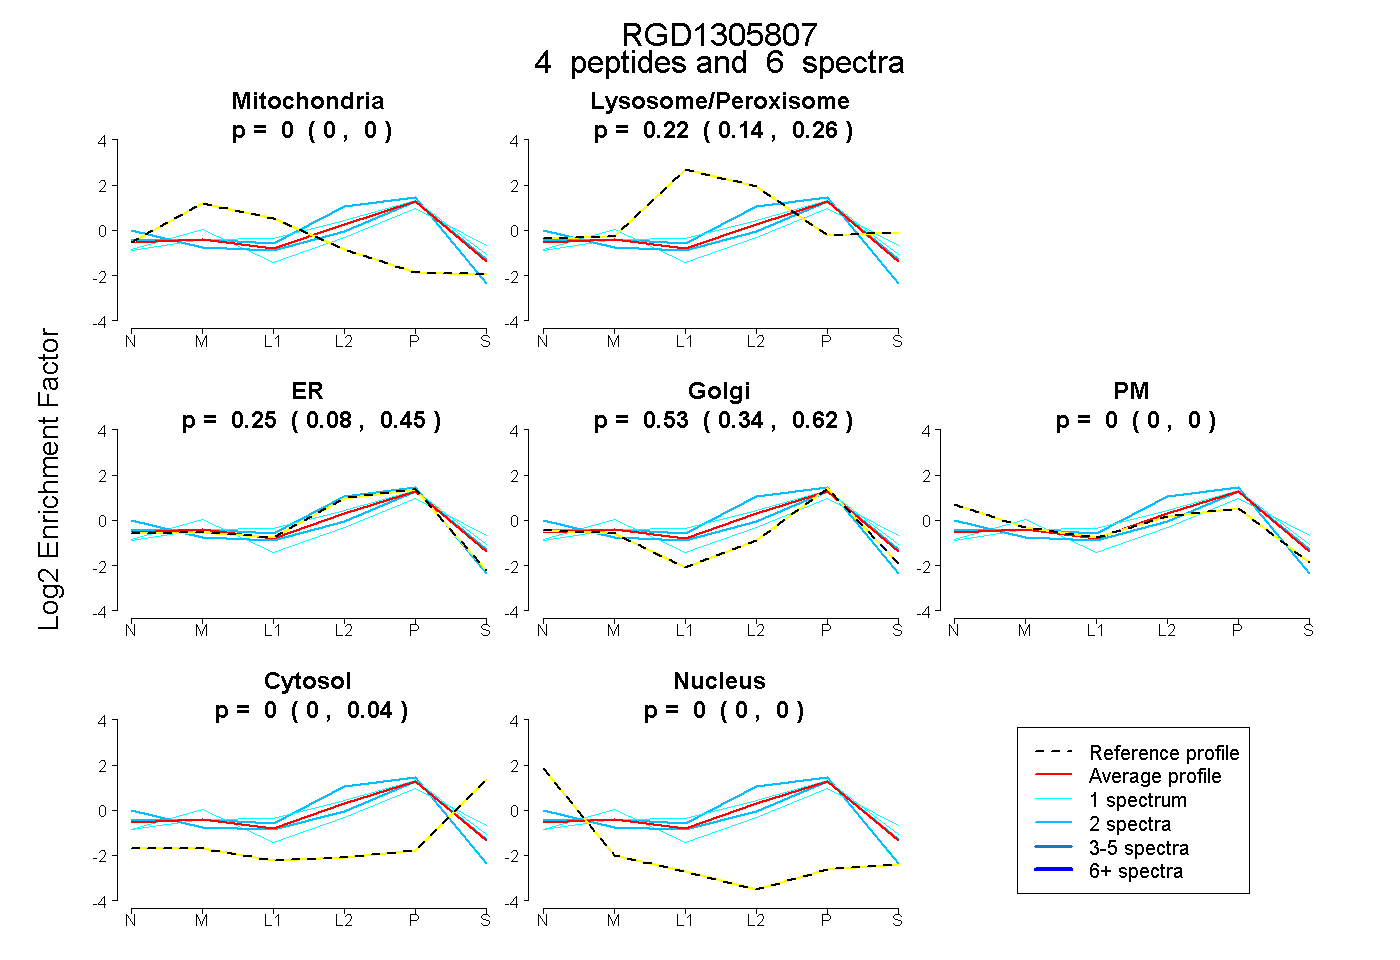 |
0.000 0.000 | 0.000 |
0.216 0.140 | 0.260 |
0.250 0.078 | 0.450 |
0.534 0.343 | 0.618 |
0.000 0.000 | 0.000 |
0.000 0.000 | 0.040 |
0.000 0.000 | 0.000 |
|||
| Plot | Lyso | Other | |||||||||||
| Expt C |
7 peptides |
26 spectra |
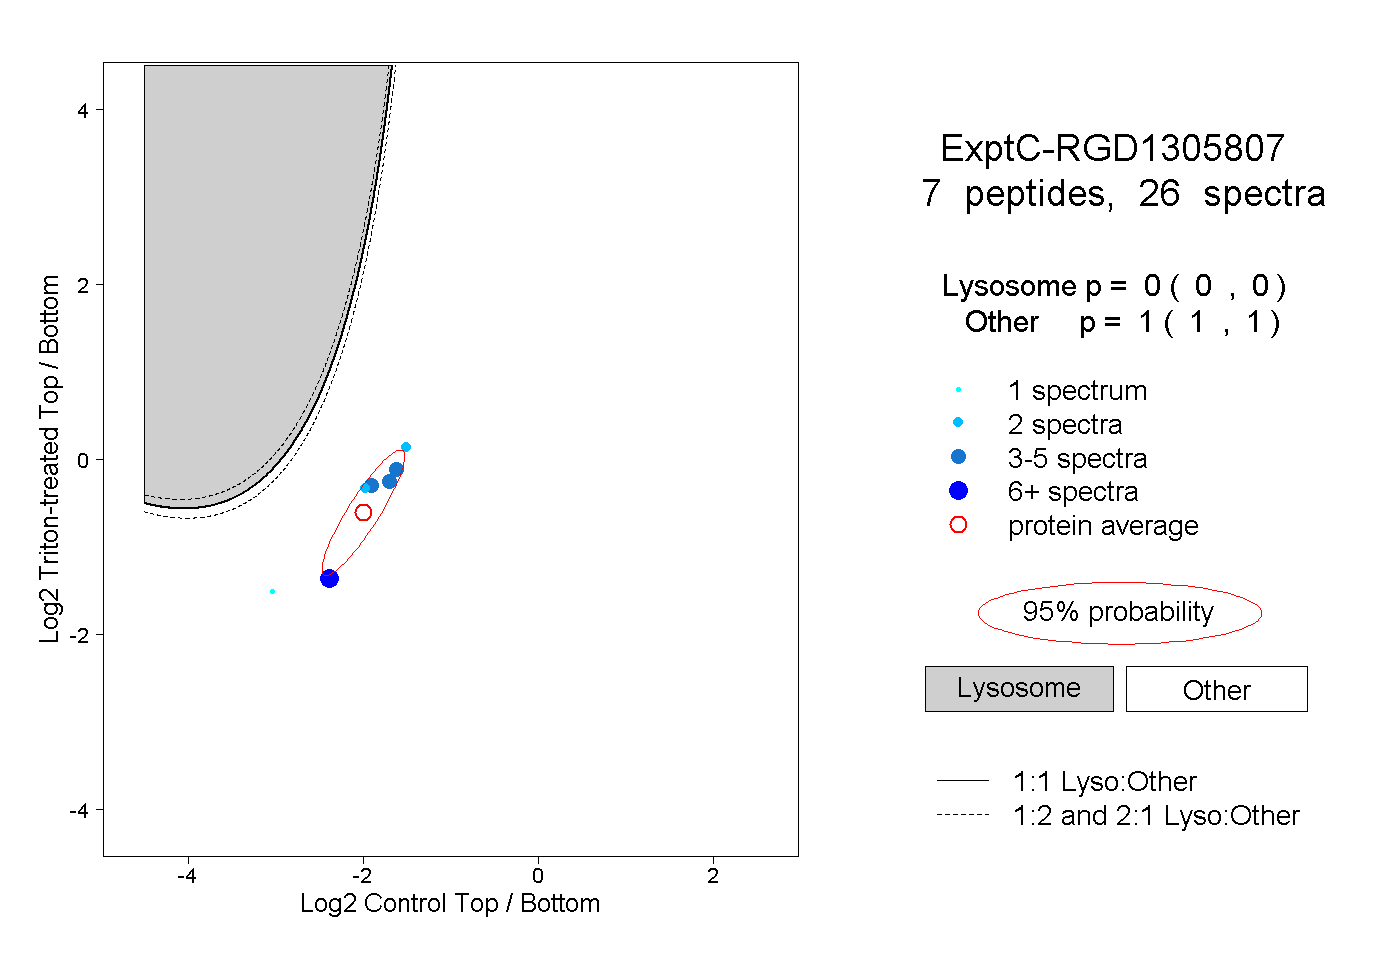 |
0.000 0.000 | 0.000 |
1.000 1.000 | 1.000 |
||||||||
| Plot | Lyso | Other | |||||||||||
| Expt D |
1 peptide |
2 spectra |
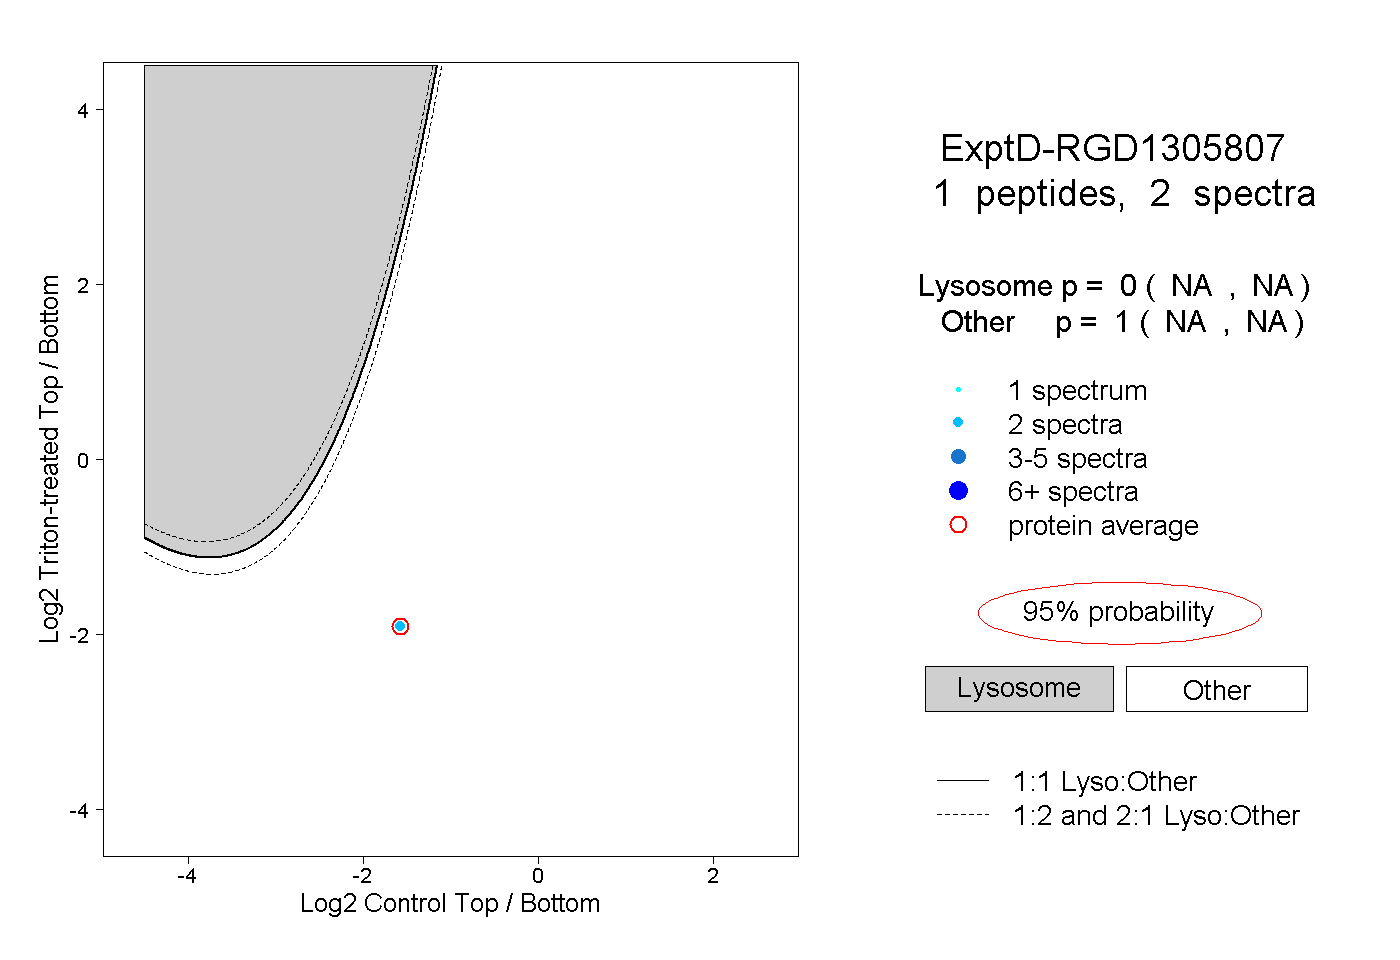 |
0.000 NA | NA |
1.000 NA | NA |