 13
13peptides
spectra
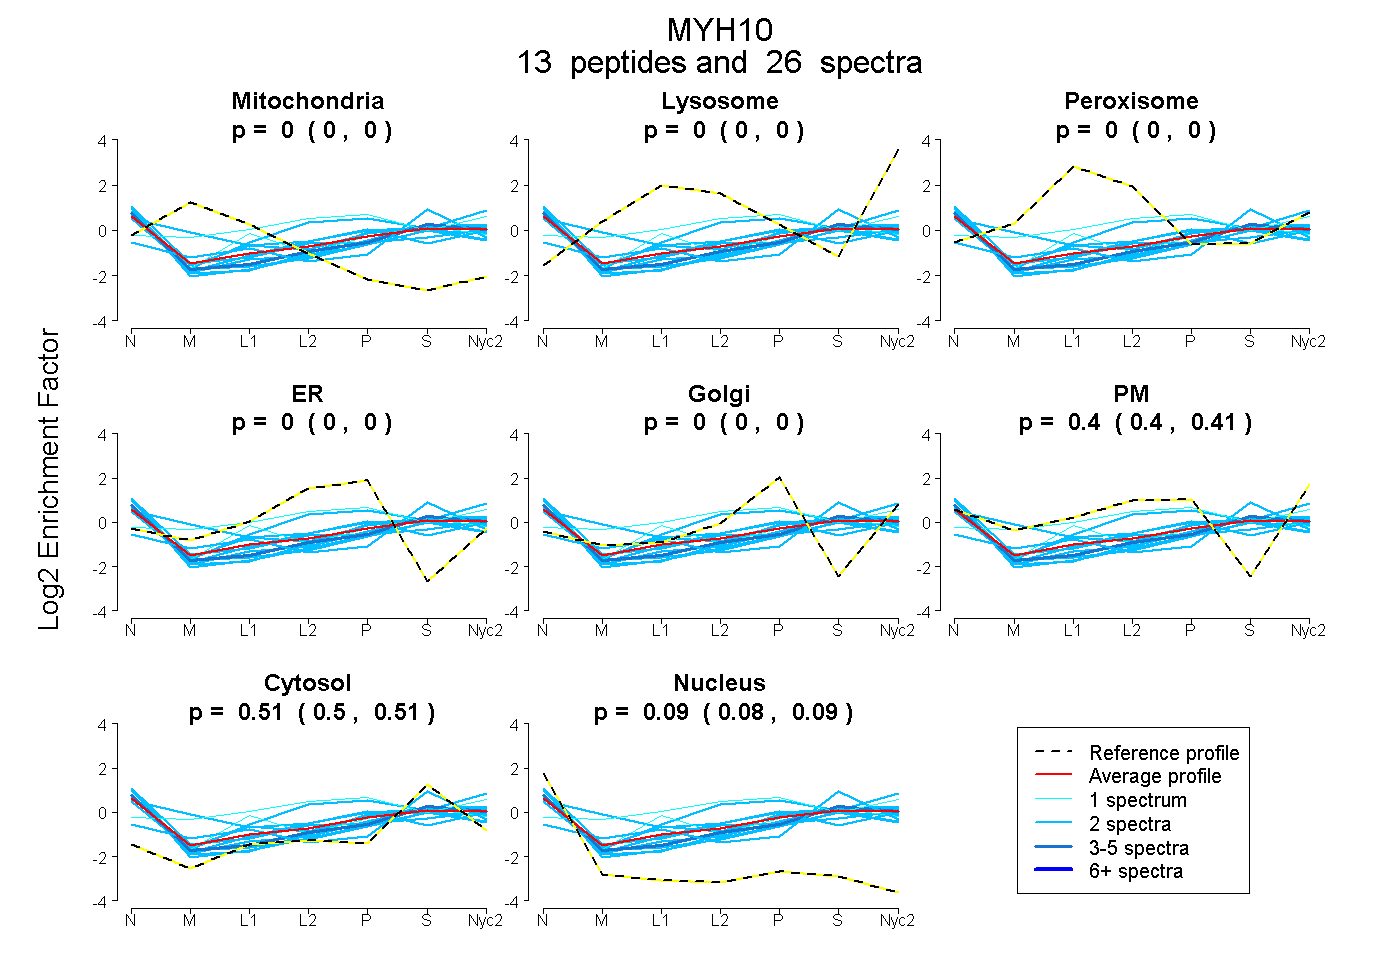
0.000 | 0.000
0.000 | 0.000
0.000 | 0.000
0.000 | 0.000
0.000 | 0.000
0.396 | 0.411
0.498 | 0.515
0.081 | 0.094
3peptides
spectra
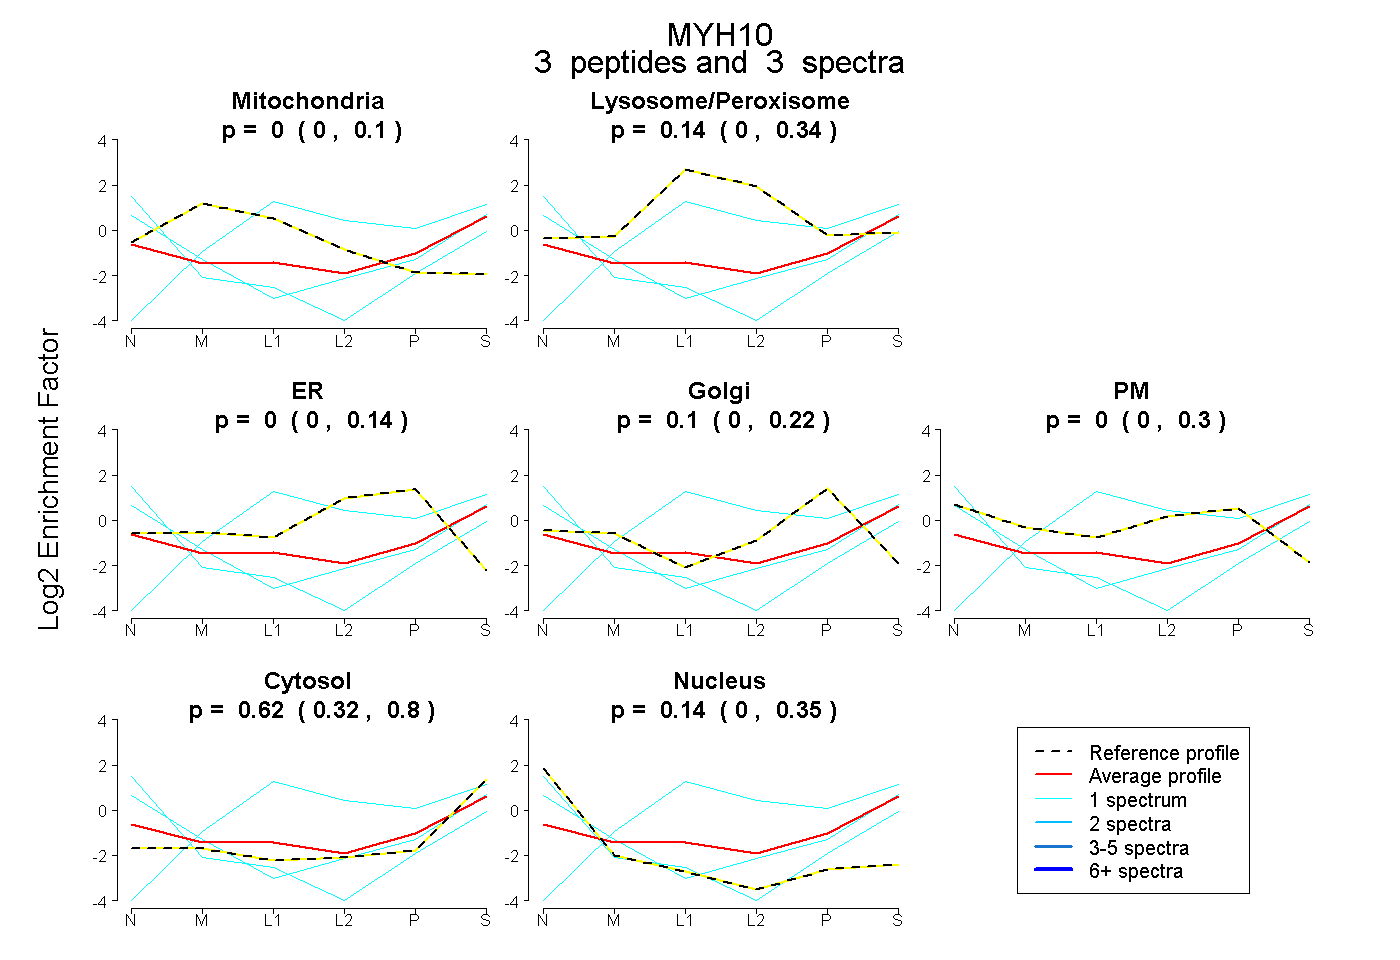
0.000 | 0.097
0.000 | 0.338
0.000 | 0.138
0.000 | 0.225
0.000 | 0.296
0.323 | 0.804
0.000 | 0.346
9peptides
spectra
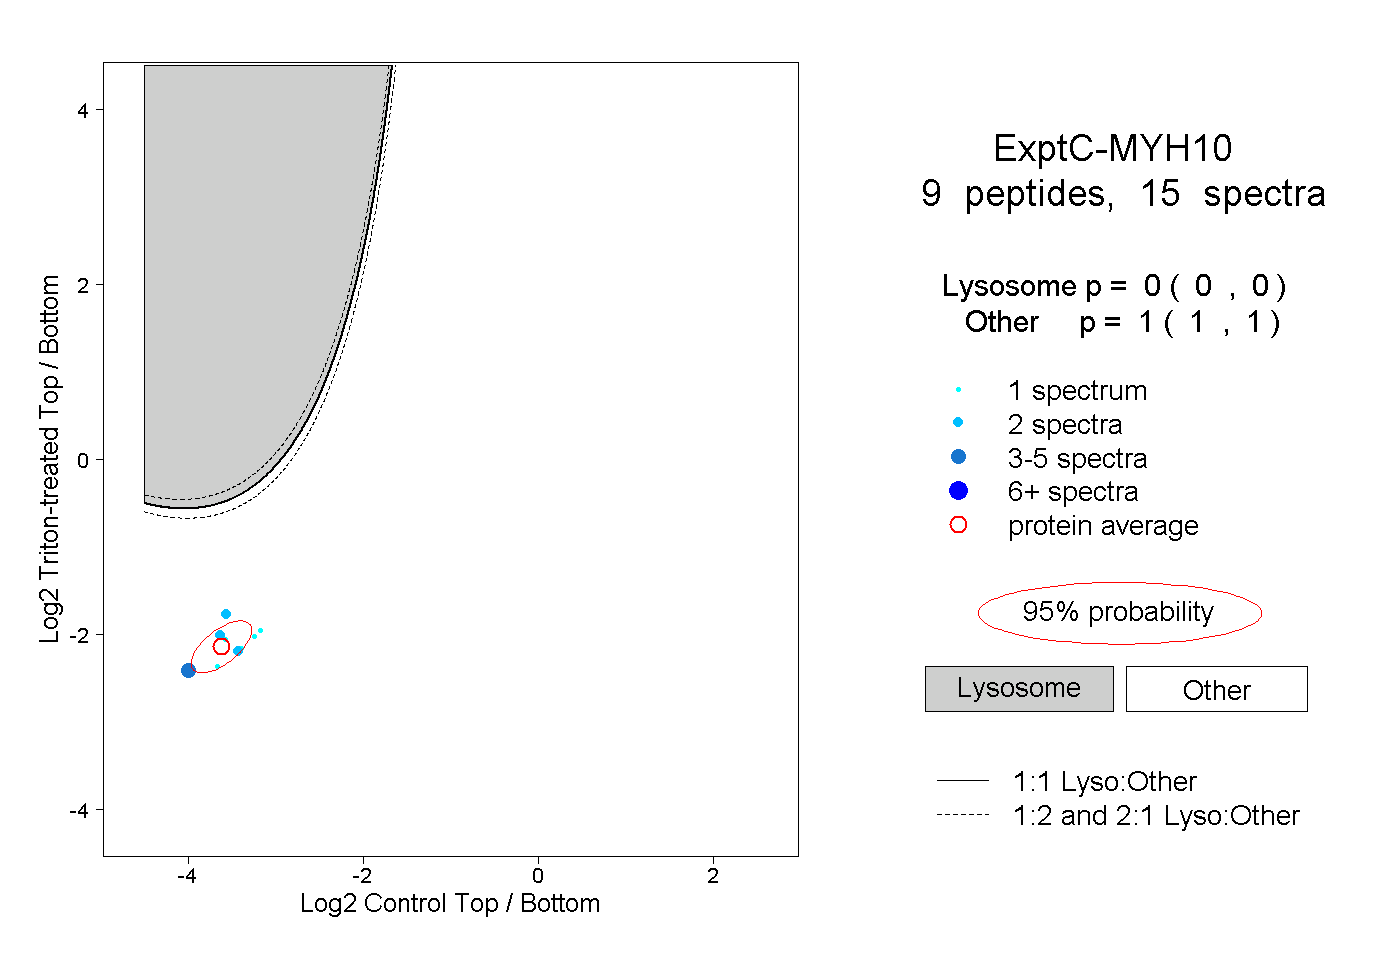
0.000 | 0.000
1.000 | 1.000
1peptide
spectrum
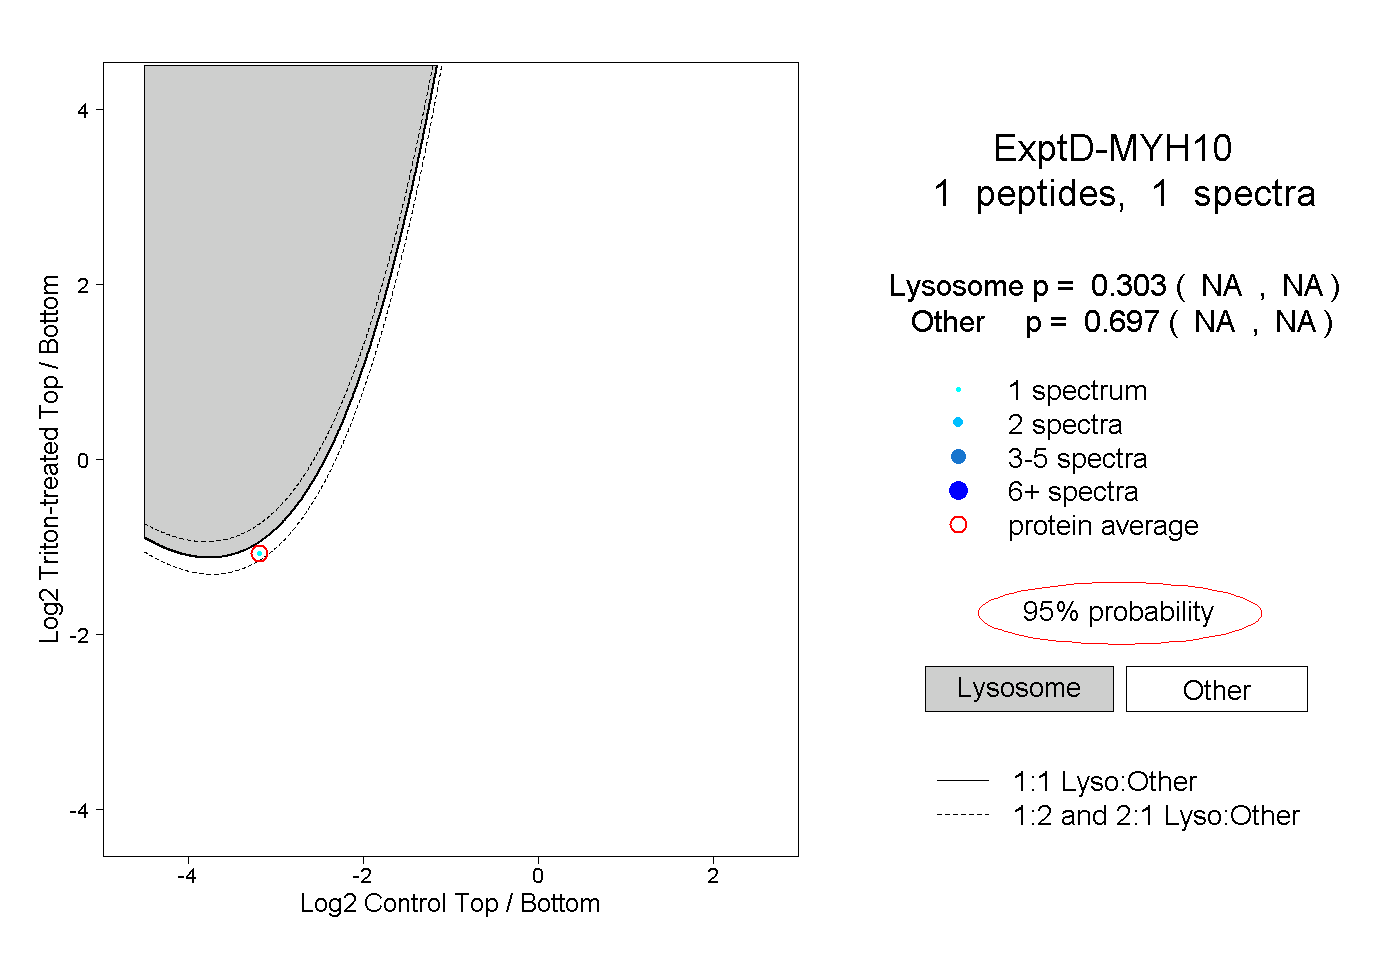
NA | NA
NA | NA