MYH10
[ENSRNOP00000062744]
Main page
| | | Plot |
Mito |
Lyso |
|
Perox |
ER |
Golgi |
PM |
Cytosol |
Nucleus |
|
| Expt A |
 13
13
peptides |
26
spectra |
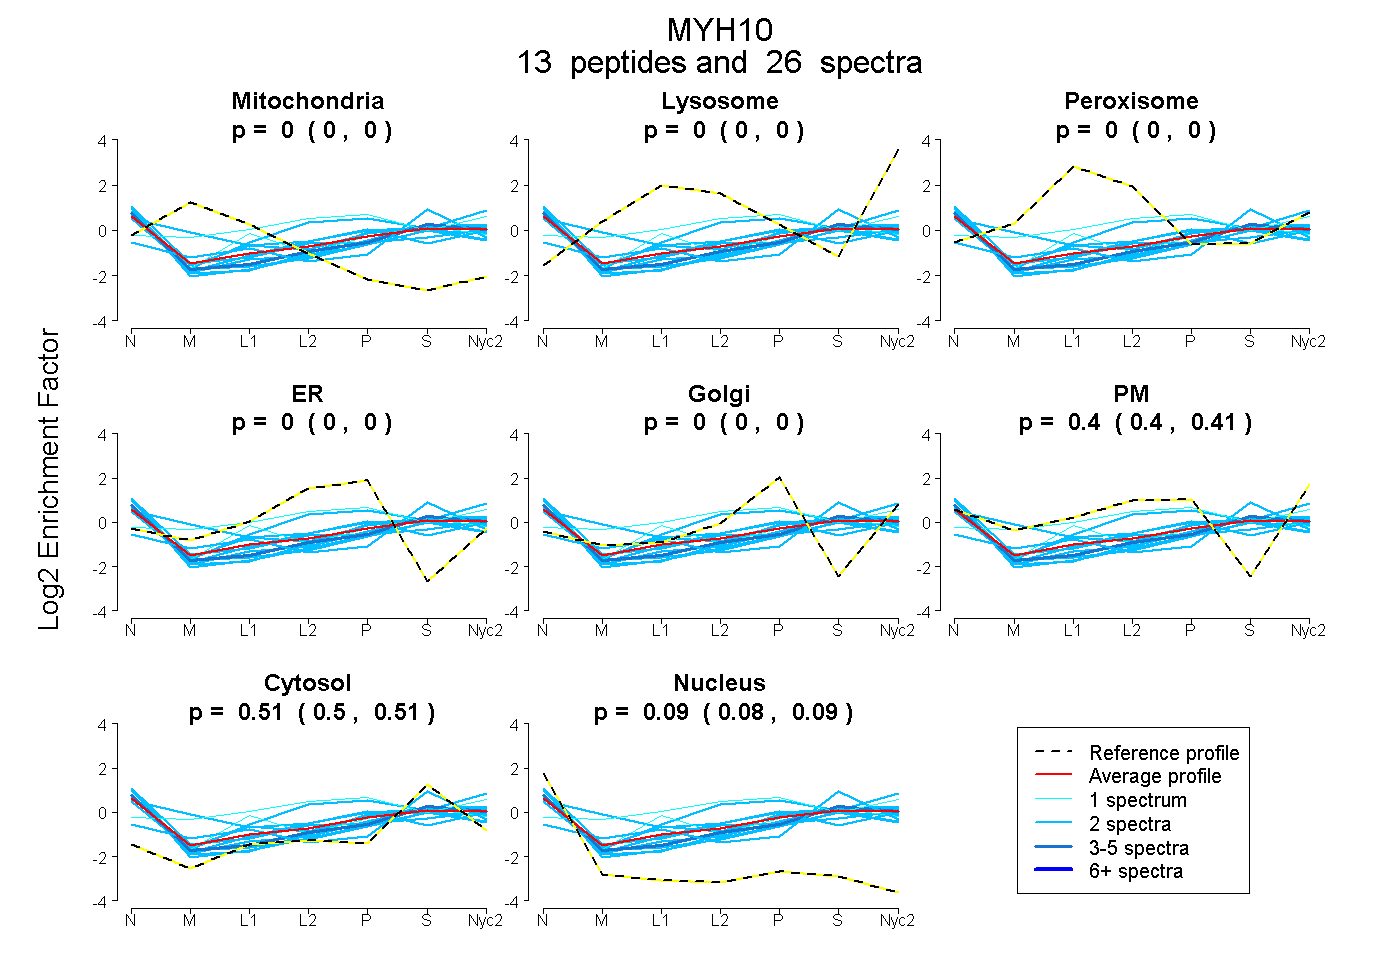 |
0.000
0.000 | 0.000 |
0.000
0.000 | 0.000 |
|
0.000
0.000 | 0.000 |
0.000
0.000 | 0.000 |
0.000
0.000 | 0.000 |
0.405
0.396 | 0.411 |
0.507
0.498 | 0.515 |
0.088
0.081 | 0.094 |
|
| | | Plot |
Mito |
|
Lyso or Perox |
|
ER |
Golgi |
PM |
Cytosol |
Nucleus |
|
| Expt B |
3
peptides |
3
spectra |
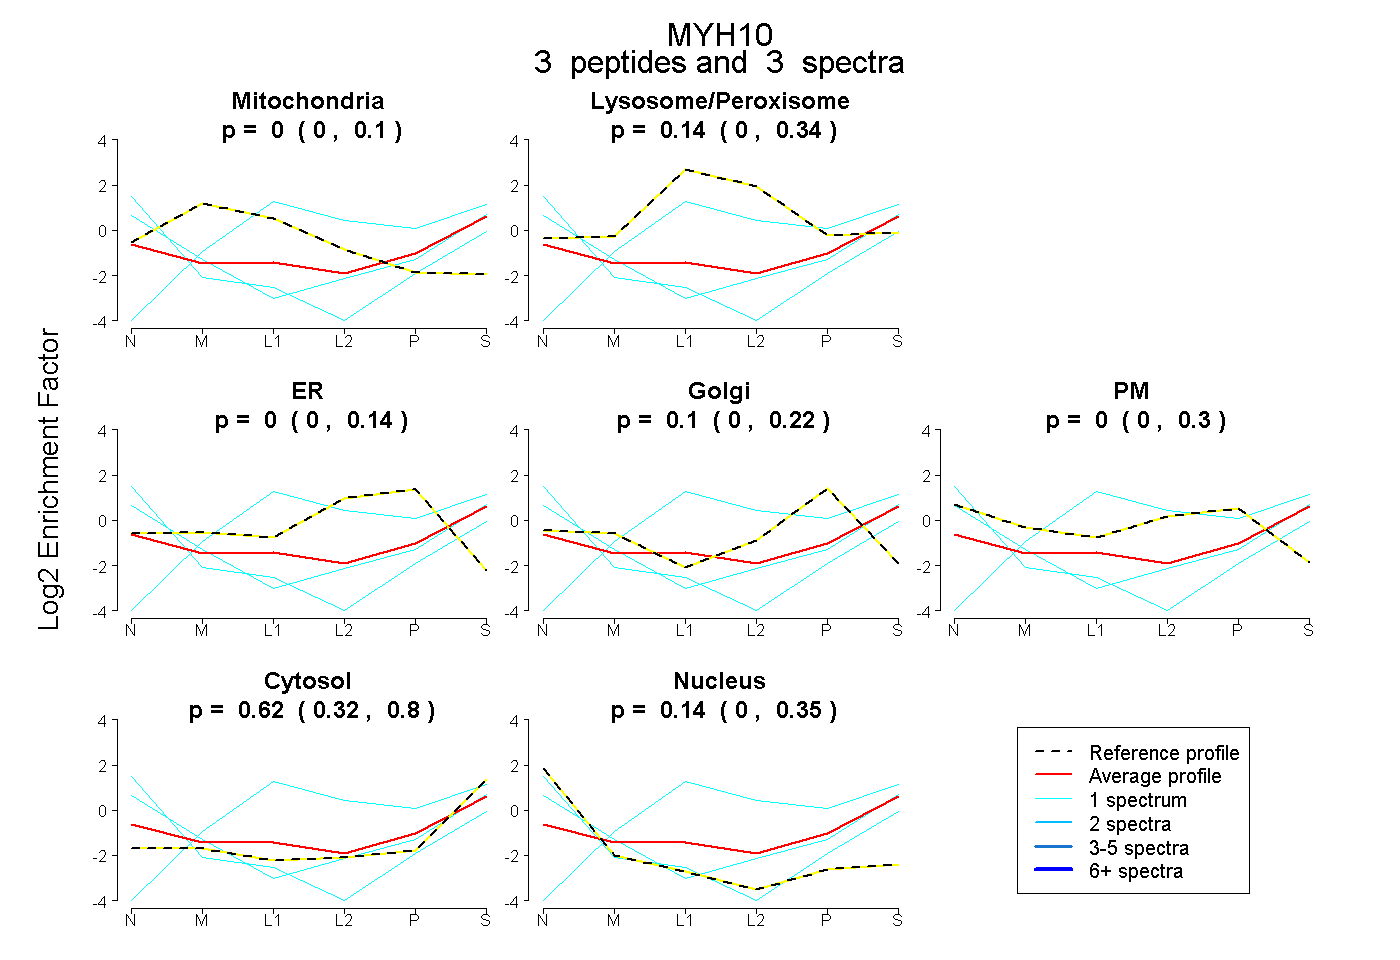 |
0.000
0.000 | 0.097 |
|
0.139
0.000 | 0.338 |
|
0.000
0.000 | 0.138 |
0.102
0.000 | 0.225 |
0.000
0.000 | 0.296 |
0.620
0.323 | 0.804 |
0.139
0.000 | 0.346 |
|
| | | Plot |
|
Lyso |
|
|
|
|
|
|
|
Other |
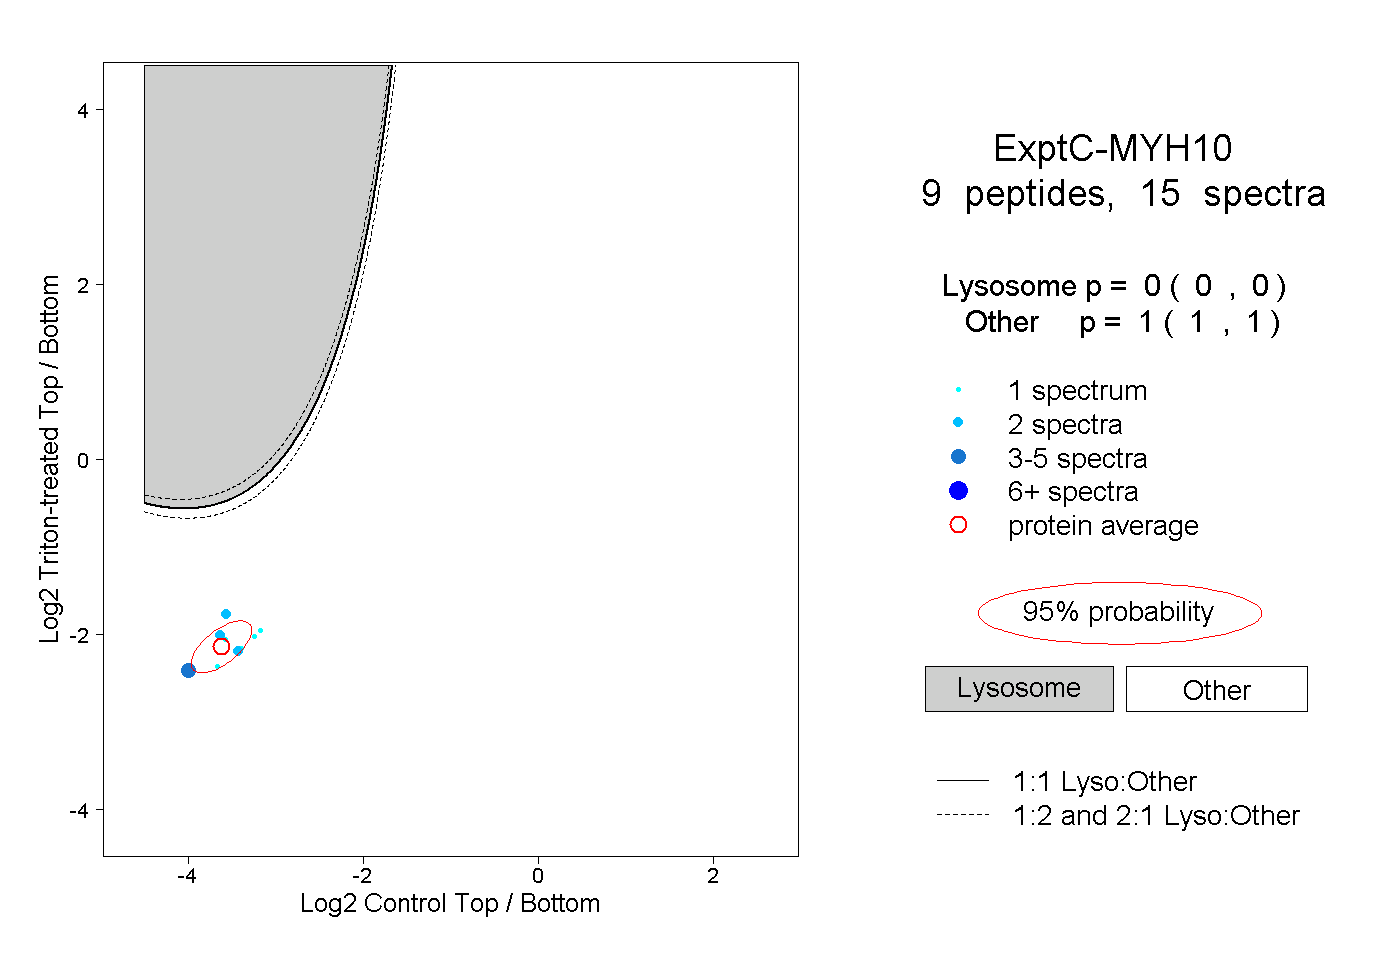
| Expt C |
9
peptides |
15
spectra |
 |
|
0.000
0.000 | 0.000 |
|
|
|
|
|
|
|
1.000
1.000 | 1.000 |
| 4 spectra, SALIDEK |
|
0.000 |
|
|
|
|
|
|
|
1.000 |
| 1 spectrum, LNLSSR |
|
0.000 |
|
|
|
|
|
|
|
1.000 |
| 1 spectrum, YLFVDR |
|
0.000 |
|
|
|
|
|
|
|
1.000 |
| 1 spectrum, ALLTPR |
|
0.000 |
|
|
|
|
|
|
|
1.000 |
| 2 spectra, DVEALSQR |
|
0.000 |
|
|
|
|
|
|
|
1.000 |
| 2 spectra, VKPLLQVTR |
|
0.000 |
|
|
|
|
|
|
|
1.000 |
| 1 spectrum, NCAAYLK |
|
0.000 |
|
|
|
|
|
|
|
1.000 |
| 2 spectra, ALELDPNLYR |
|
0.000 |
|
|
|
|
|
|
|
1.000 |
| 1 spectrum, QLVSNLEK |
|
0.000 |
|
|
|
|
|
|
|
1.000 |
| | | Plot |
|
Lyso |
|
|
|
|
|
|
|
Other |
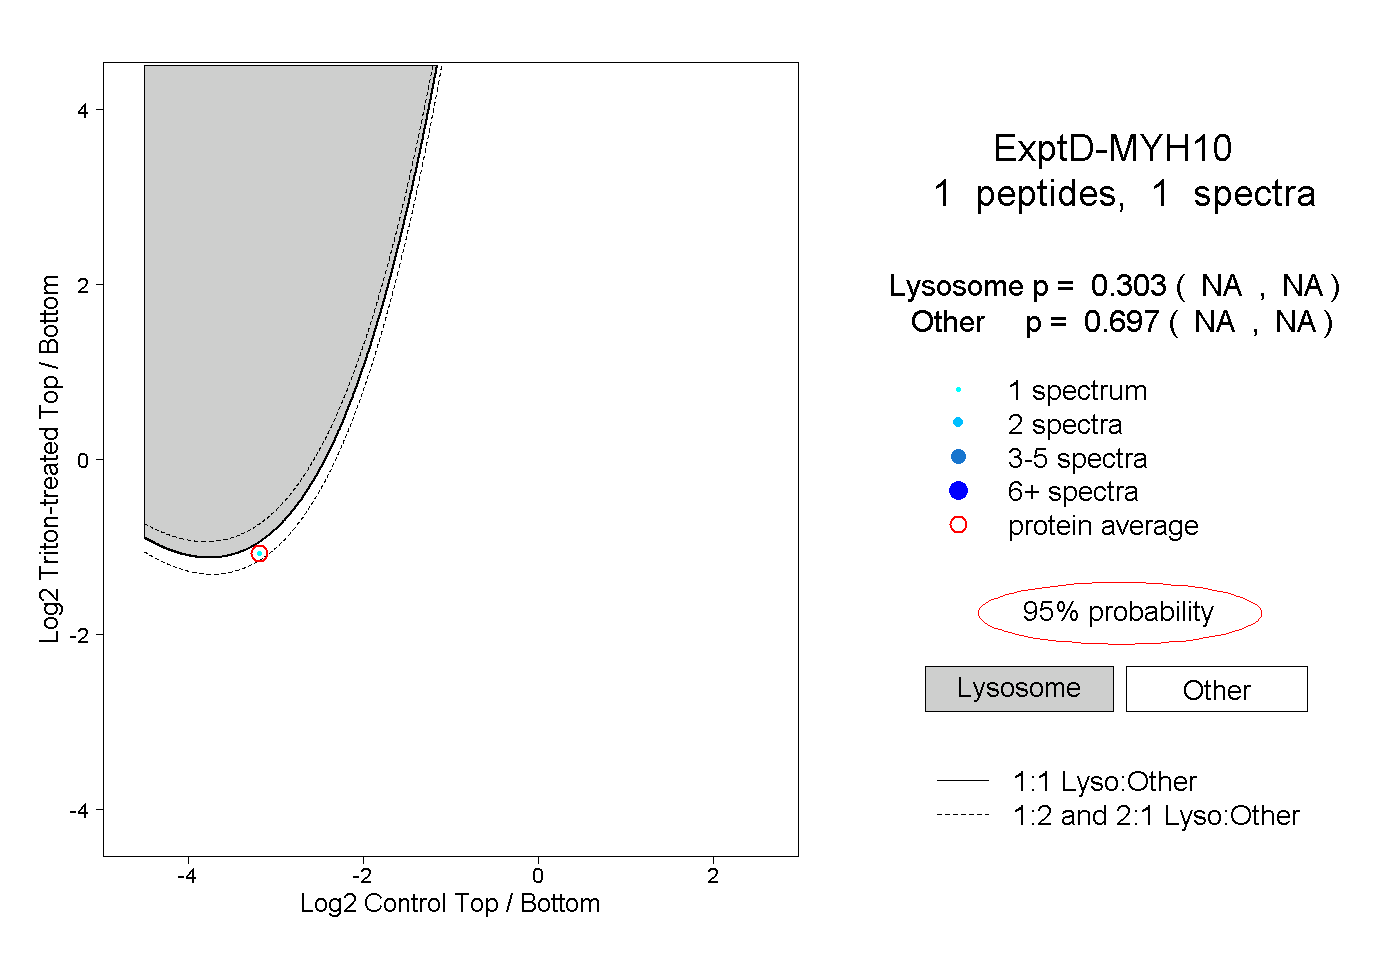
| Expt D |
1
peptide |
1
spectrum |
 |
|
0.303
NA | NA |
|
|
|
|
|
|
|
0.697
NA | NA |