 13
13peptides
spectra
0.000 | 0.000
0.000 | 0.000
0.000 | 0.000
0.000 | 0.000
0.000 | 0.000
0.396 | 0.411
0.498 | 0.515
0.081 | 0.094
| Plot | Mito | Lyso | Perox | ER | Golgi | PM | Cytosol | Nucleus | |||||
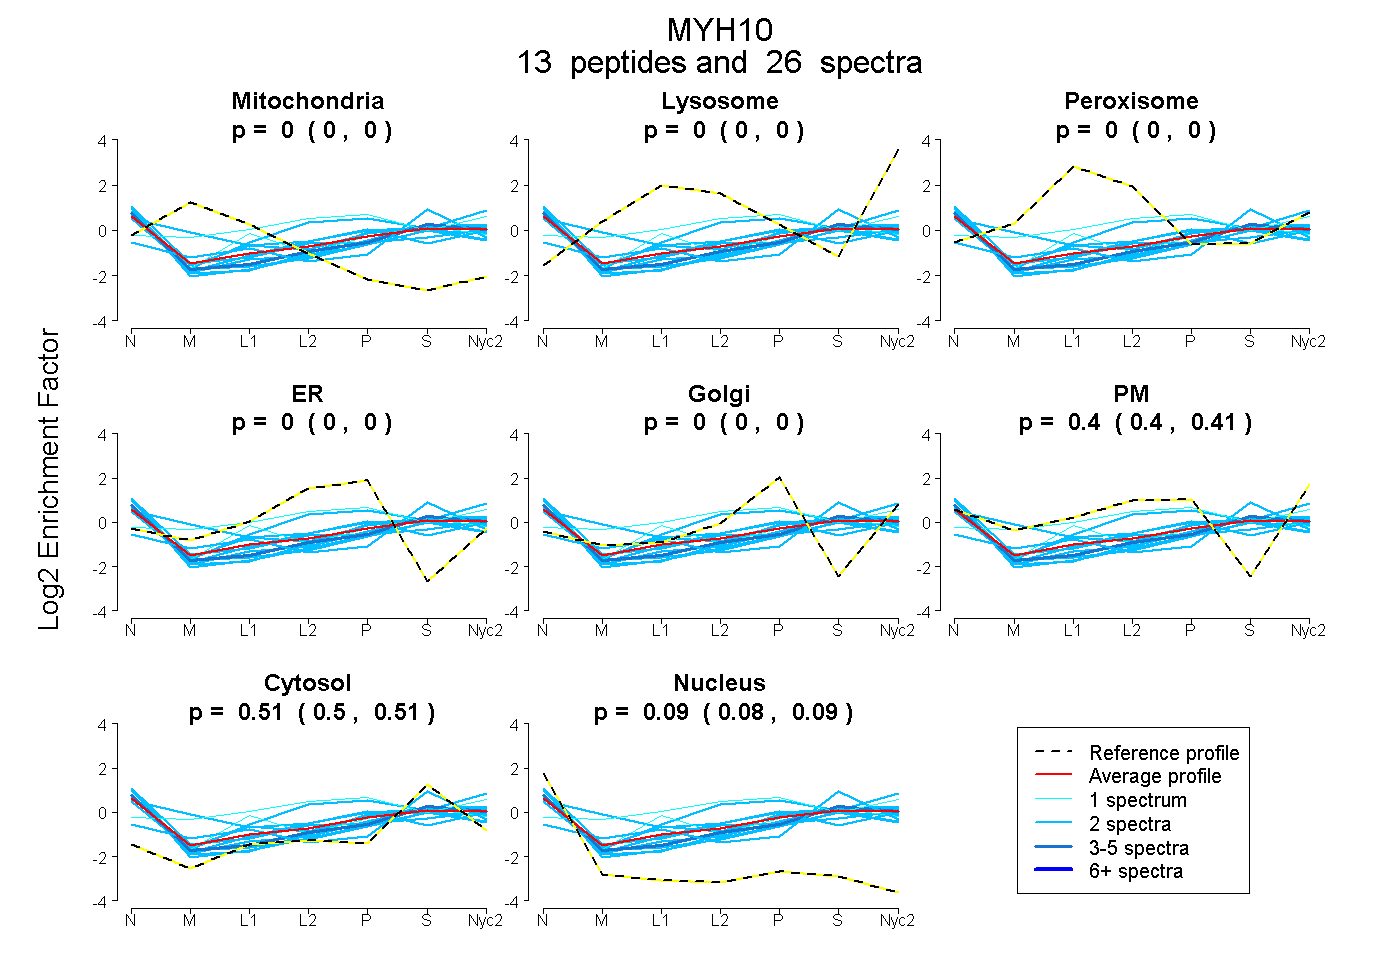
| Expt A |
13 peptides |
26 spectra |
|
0.000 0.000 | 0.000 |
0.000 0.000 | 0.000 |
0.000 0.000 | 0.000 |
0.000 0.000 | 0.000 |
0.000 0.000 | 0.000 |
0.405 0.396 | 0.411 |
0.507 0.498 | 0.515 |
0.088 0.081 | 0.094 |
| 2 spectra, QEVMISDLEER | 0.000 | 0.000 | 0.000 | 0.000 | 0.000 | 0.424 | 0.520 | 0.057 | ||
| 1 spectrum, SDLLLEGFNNYR | 0.000 | 0.000 | 0.132 | 0.000 | 0.000 | 0.289 | 0.463 | 0.116 | ||
| 2 spectra, LQELEGAVK | 0.187 | 0.000 | 0.000 | 0.000 | 0.000 | 0.475 | 0.322 | 0.016 | ||
| 2 spectra, TGLEDPER | 0.000 | 0.000 | 0.000 | 0.000 | 0.000 | 0.424 | 0.504 | 0.072 | ||
| 2 spectra, DHNIPGELER | 0.000 | 0.000 | 0.000 | 0.000 | 0.000 | 0.567 | 0.433 | 0.000 | ||
| 2 spectra, ALEQQVEEMR | 0.000 | 0.000 | 0.000 | 0.000 | 0.000 | 0.335 | 0.539 | 0.126 | ||
| 2 spectra, VELAEK | 0.121 | 0.045 | 0.028 | 0.000 | 0.000 | 0.073 | 0.732 | 0.000 | ||
| 2 spectra, ELDDATEANEGLSR | 0.000 | 0.000 | 0.000 | 0.000 | 0.095 | 0.273 | 0.469 | 0.163 | ||
| 1 spectrum, VVSSVLQFGNISFK | 0.000 | 0.021 | 0.299 | 0.000 | 0.250 | 0.161 | 0.269 | 0.000 | ||
| 2 spectra, DVEALSQR | 0.000 | 0.000 | 0.000 | 0.000 | 0.000 | 0.307 | 0.474 | 0.219 | ||
| 2 spectra, GDDETLHK | 0.000 | 0.000 | 0.000 | 0.000 | 0.000 | 0.292 | 0.477 | 0.231 | ||
| 4 spectra, VEGELEEMER | 0.000 | 0.000 | 0.000 | 0.000 | 0.000 | 0.334 | 0.540 | 0.126 | ||
| 2 spectra, FVAELWK | 0.000 | 0.000 | 0.000 | 0.000 | 0.000 | 0.438 | 0.398 | 0.164 |
| Plot | Mito | Lyso or Perox | ER | Golgi | PM | Cytosol | Nucleus | ||||||
| Expt B |
3 peptides |
3 spectra |
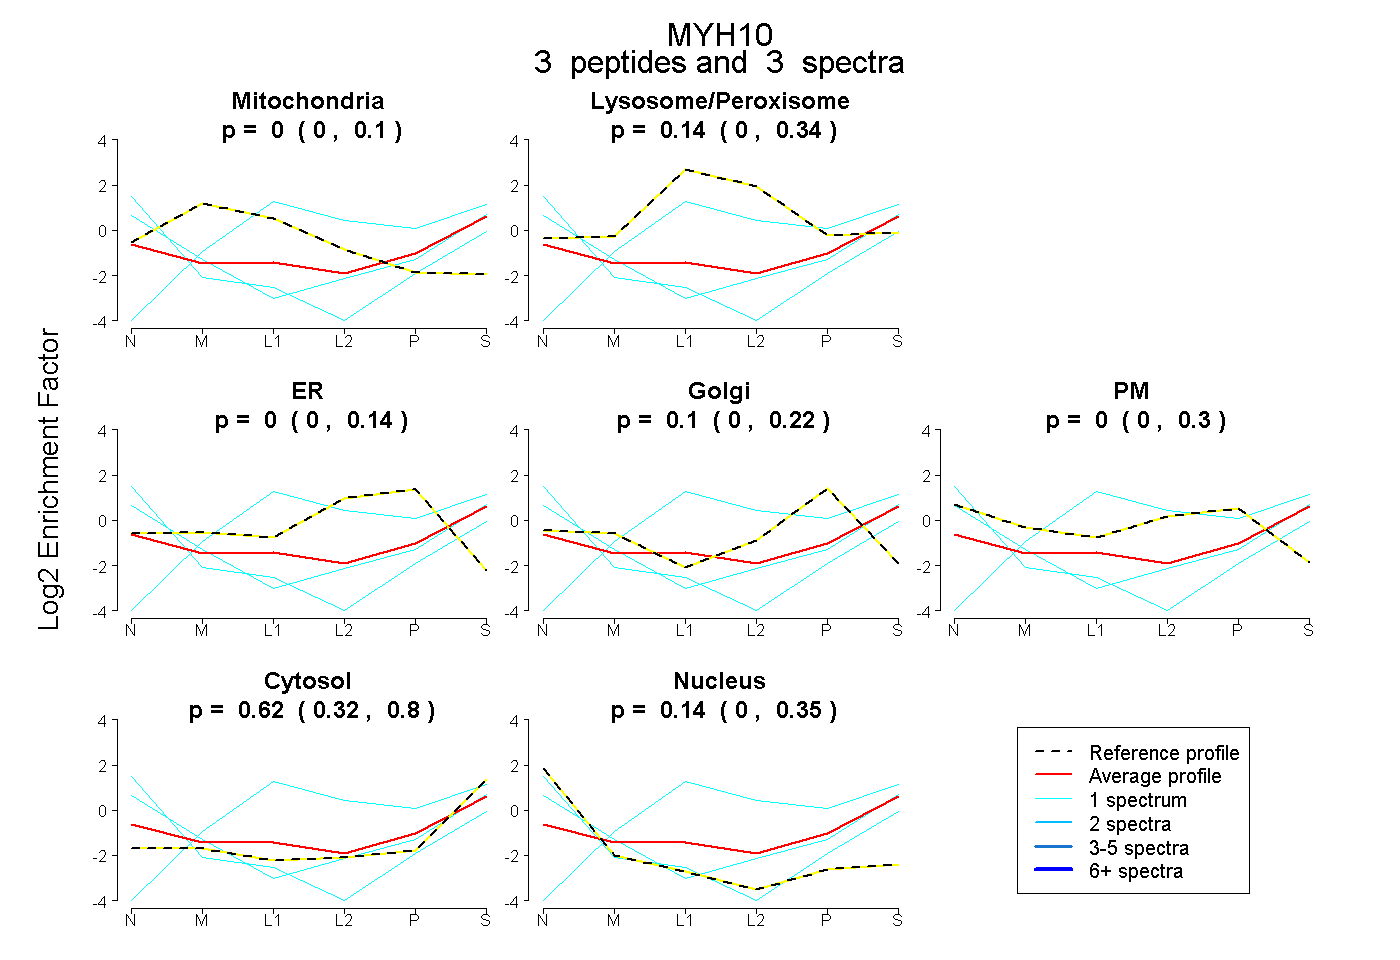 |
0.000 0.000 | 0.097 |
0.139 0.000 | 0.338 |
0.000 0.000 | 0.138 |
0.102 0.000 | 0.225 |
0.000 0.000 | 0.296 |
0.620 0.323 | 0.804 |
0.139 0.000 | 0.346 |
|||
| Plot | Lyso | Other | |||||||||||
| Expt C |
9 peptides |
15 spectra |
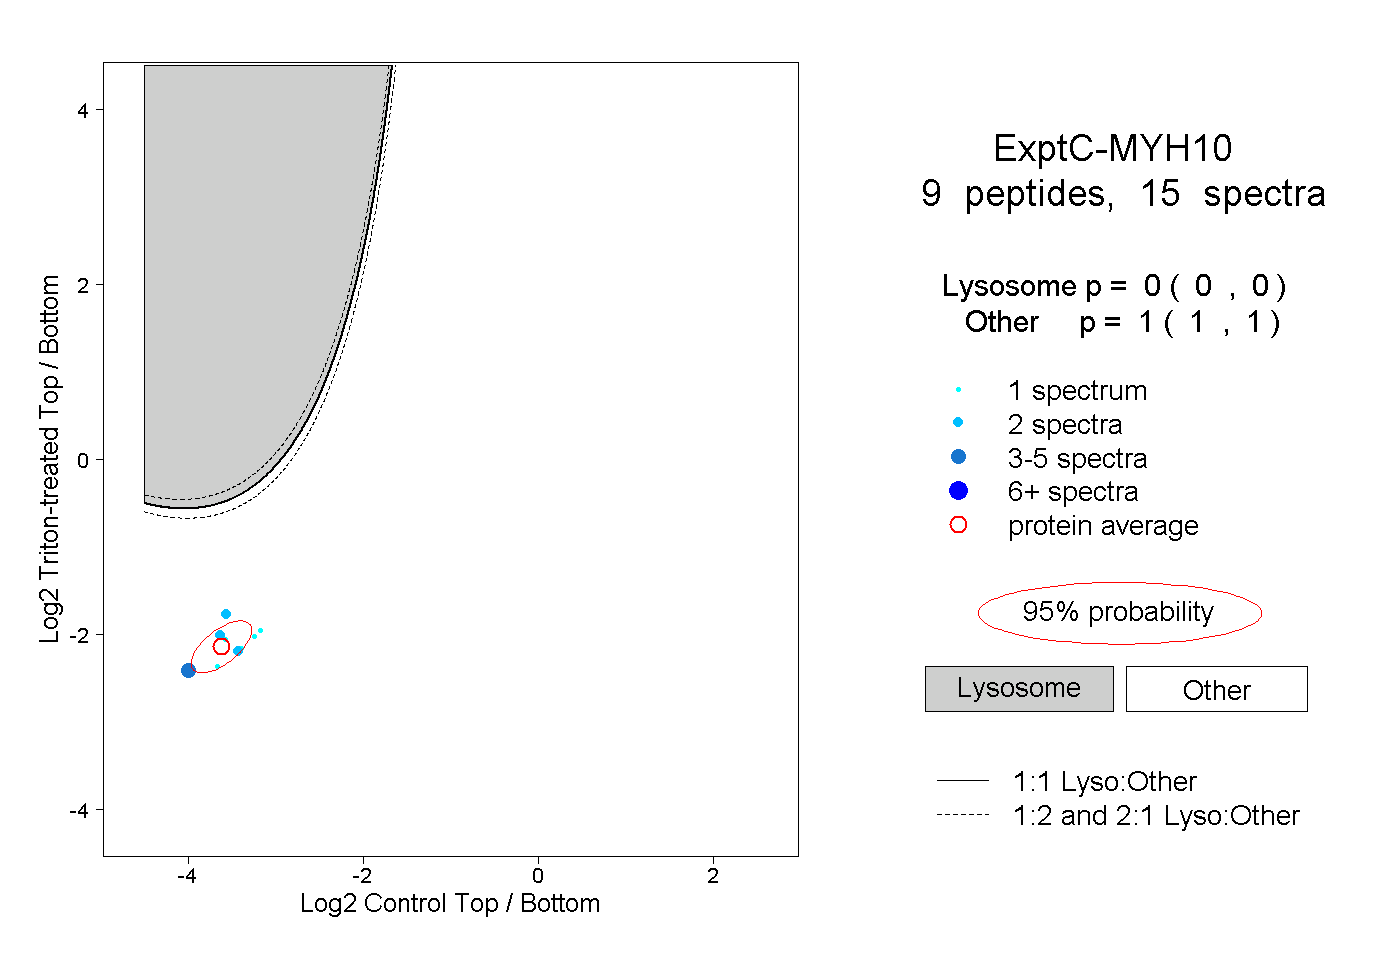 |
0.000 0.000 | 0.000 |
1.000 1.000 | 1.000 |
||||||||
| Plot | Lyso | Other | |||||||||||
| Expt D |
1 peptide |
1 spectrum |
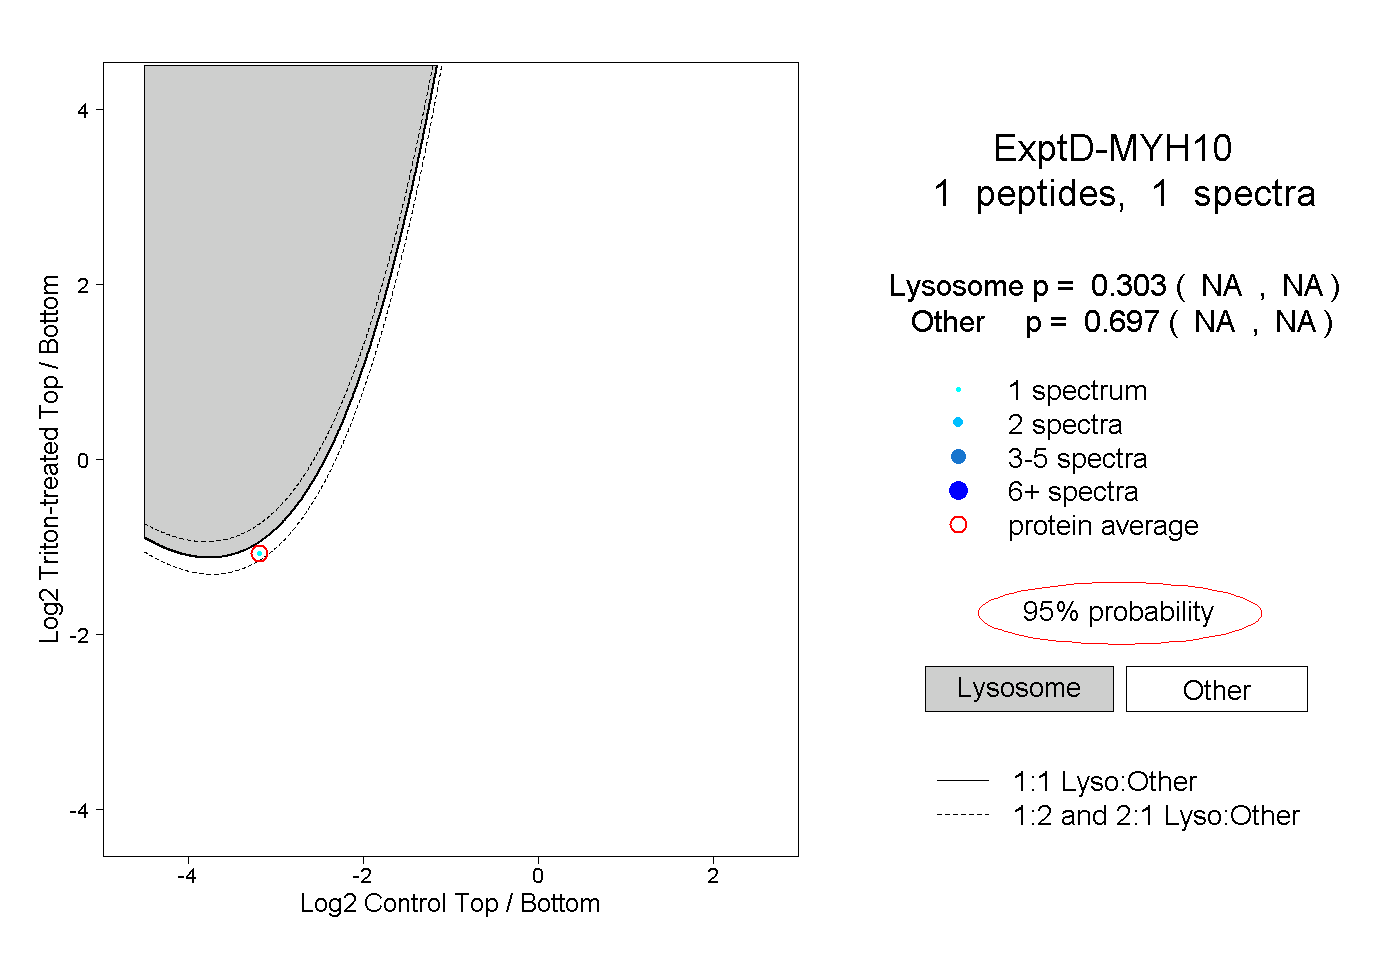 |
0.303 NA | NA |
0.697 NA | NA |