 5
5peptides
spectra
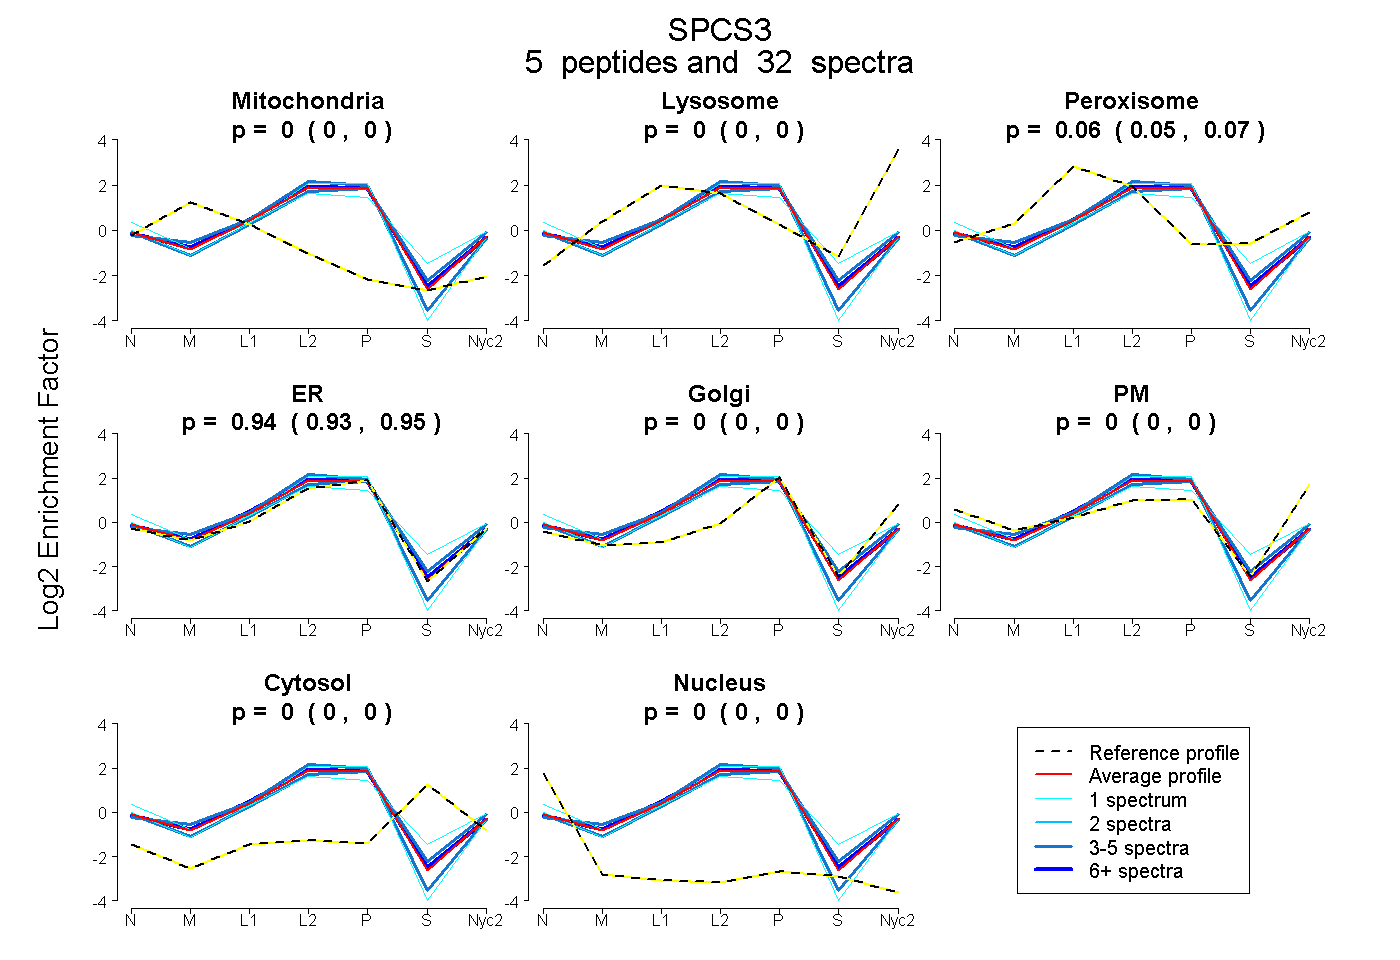
0.000 | 0.000
0.000 | 0.000
0.053 | 0.070
0.929 | 0.945
0.000 | 0.000
0.000 | 0.000
0.000 | 0.000
0.000 | 0.000
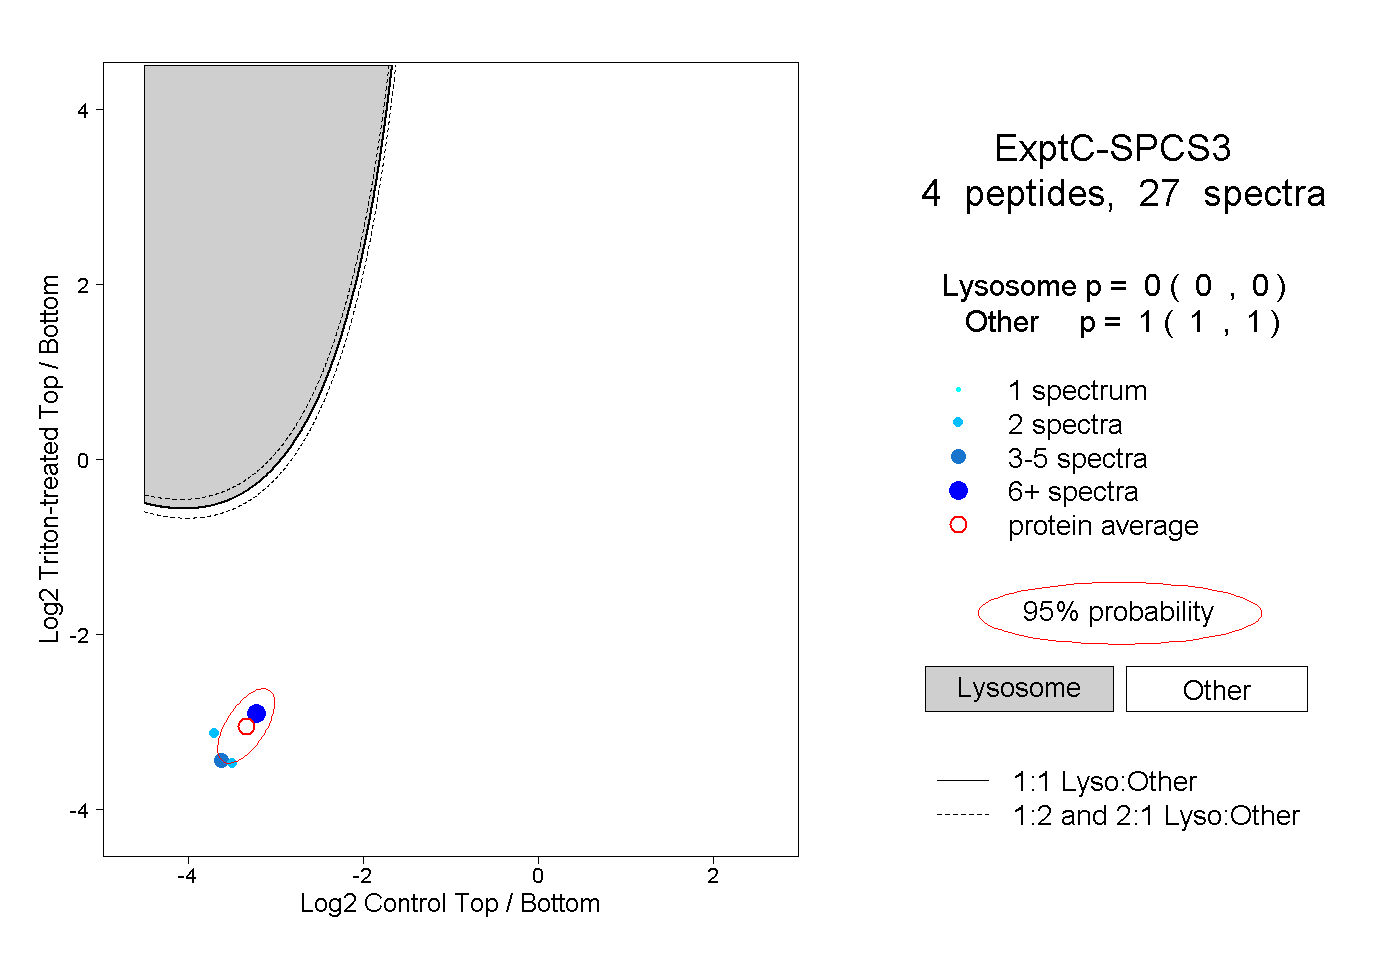
3peptides
spectra

0.000 | 0.000
0.110 | 0.149
0.798 | 0.860
0.000 | 0.000
0.000 | 0.050
0.000 | 0.028
0.000 | 0.000
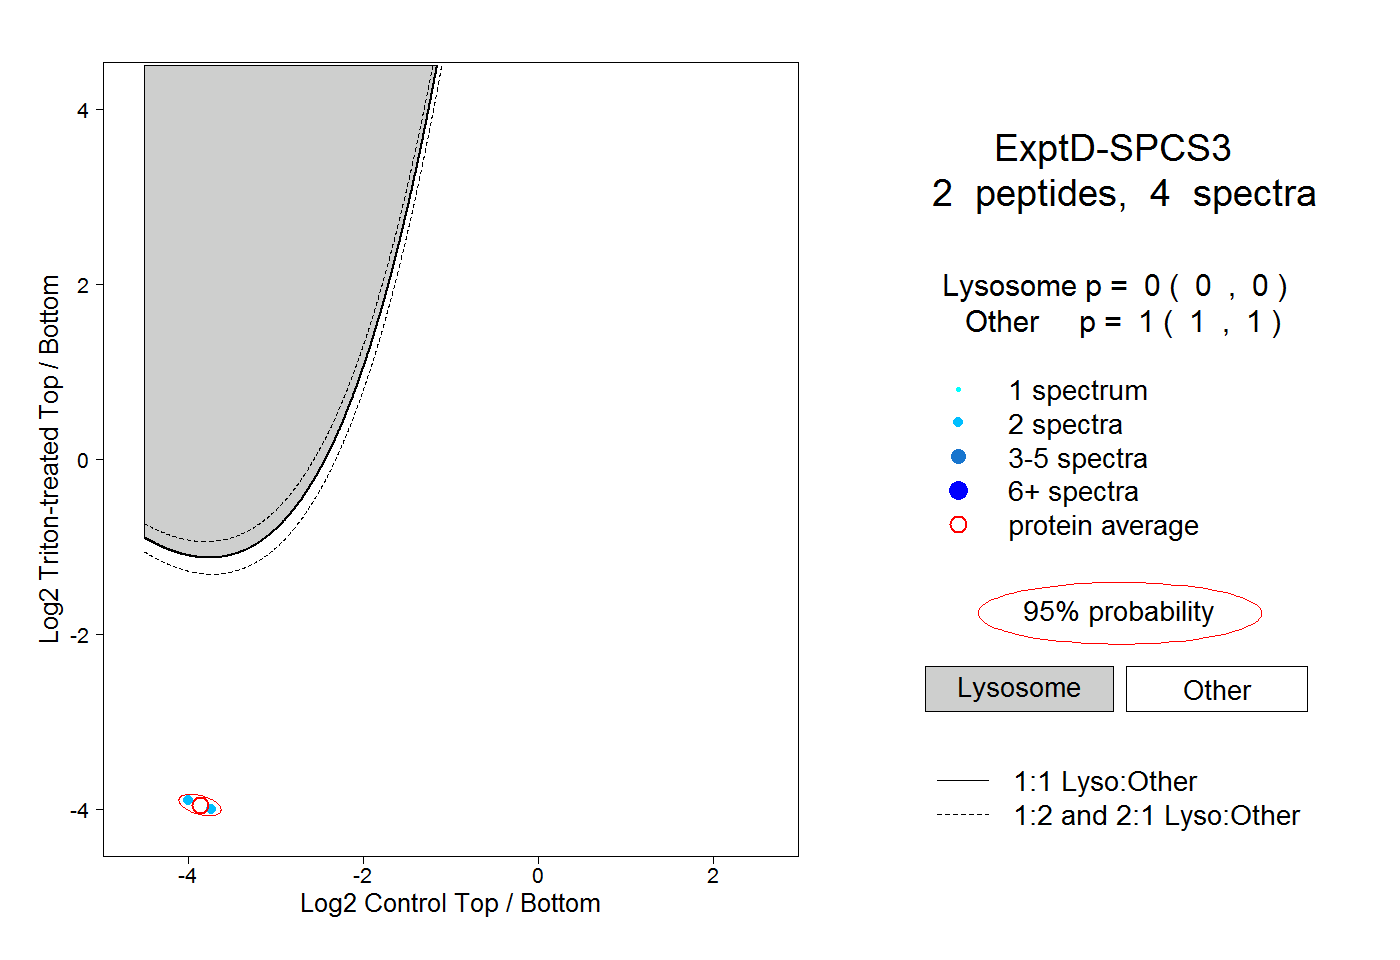
4peptides
spectra
0.000 | 0.000
1.000 | 1.000
2peptides
spectra
0.000 | 0.000
1.000 | 1.000