SPCS3
[ENSRNOP00000062708]
Main page
| | | Plot |
Mito |
Lyso |
|
Perox |
ER |
Golgi |
PM |
Cytosol |
Nucleus |
|
| Expt A |
 5
5
peptides |
32
spectra |
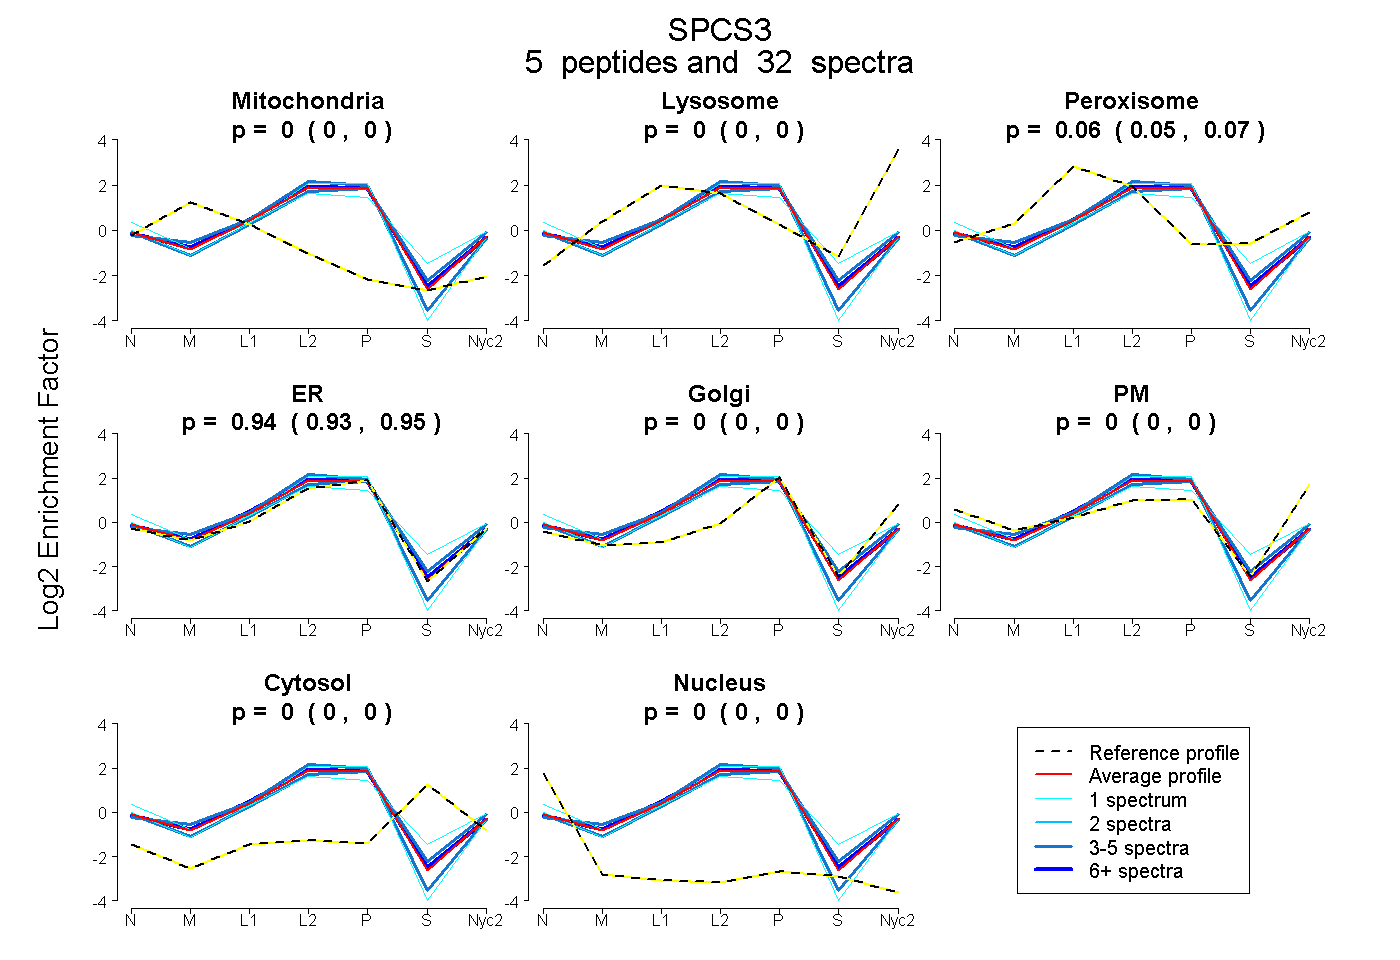 |
0.000
0.000 | 0.000 |
0.000
0.000 | 0.000 |
|
0.062
0.053 | 0.070 |
0.938
0.929 | 0.945 |
0.000
0.000 | 0.000 |
0.000
0.000 | 0.000 |
0.000
0.000 | 0.000 |
0.000
0.000 | 0.000 |
|
| | | Plot |
Mito |
|
Lyso or Perox |
|
ER |
Golgi |
PM |
Cytosol |
Nucleus |
|
| Expt B |
3
peptides |
16
spectra |
 |
0.000
0.000 | 0.000 |
|
0.132
0.110 | 0.149 |
|
0.833
0.798 | 0.860 |
0.000
0.000 | 0.000 |
0.024
0.000 | 0.050 |
0.011
0.000 | 0.028 |
0.000
0.000 | 0.000 |
|
| 4 spectra, NVEDFTGPR |
0.000 |
|
0.078 |
|
0.902 |
0.000 |
0.020 |
0.000 |
0.000 |
|
| 3 spectra, YFFFDDGNGLK |
0.000 |
|
0.136 |
|
0.756 |
0.000 |
0.000 |
0.108 |
0.000 |
|
| 9 spectra, MNTVLSR |
0.000 |
|
0.158 |
|
0.777 |
0.000 |
0.055 |
0.010 |
0.000 |
|
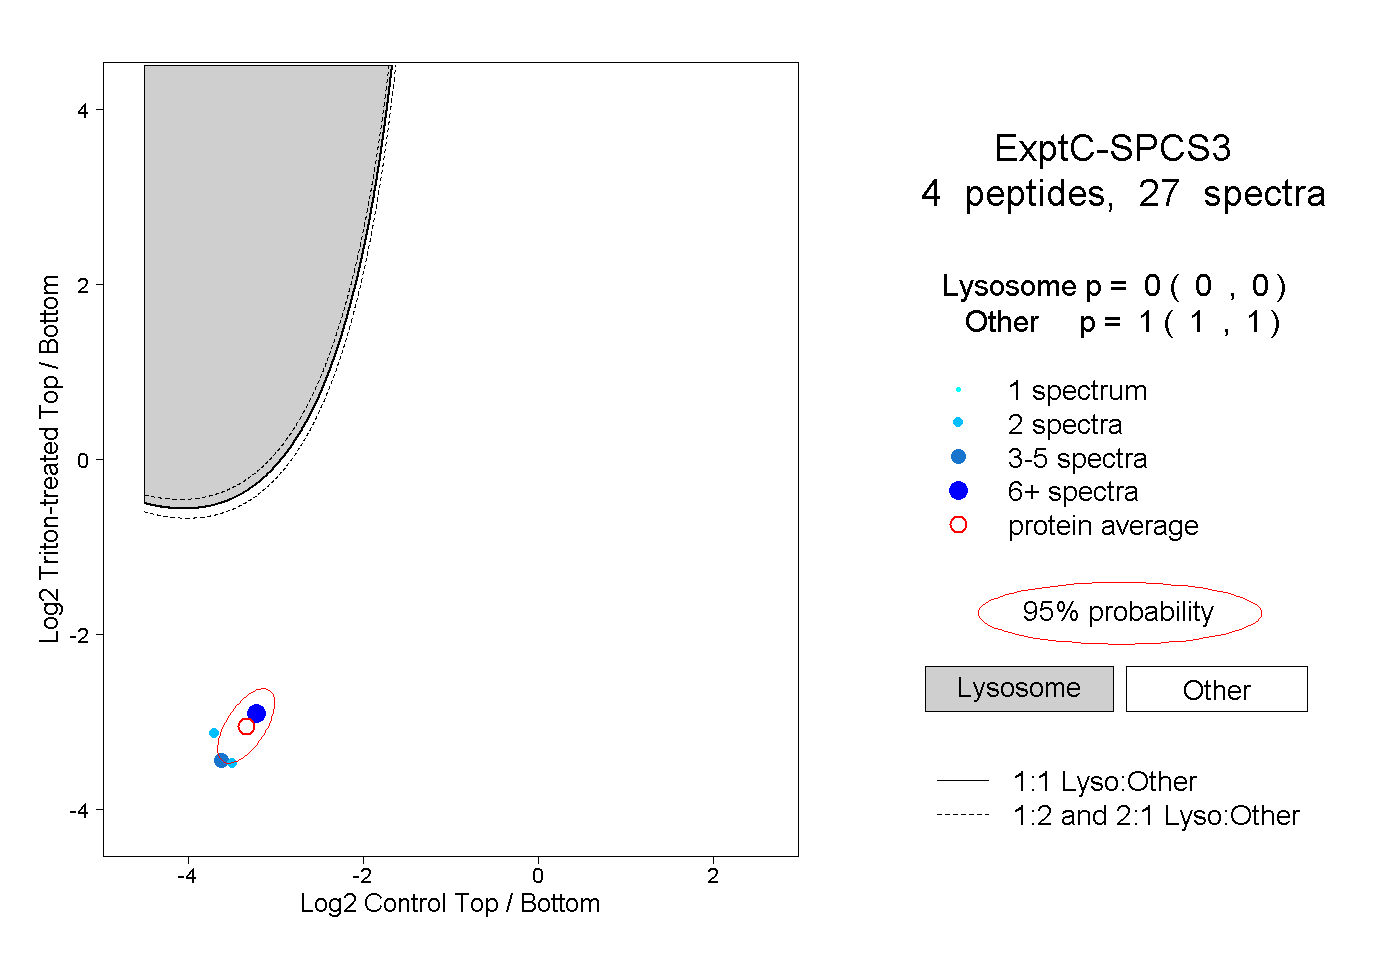
| | | Plot |
|
Lyso |
|
|
|
|
|
|
|
Other |
| Expt C |
4
peptides |
27
spectra |
 |
|
0.000
0.000 | 0.000 |
|
|
|
|
|
|
|
1.000
1.000 | 1.000 |
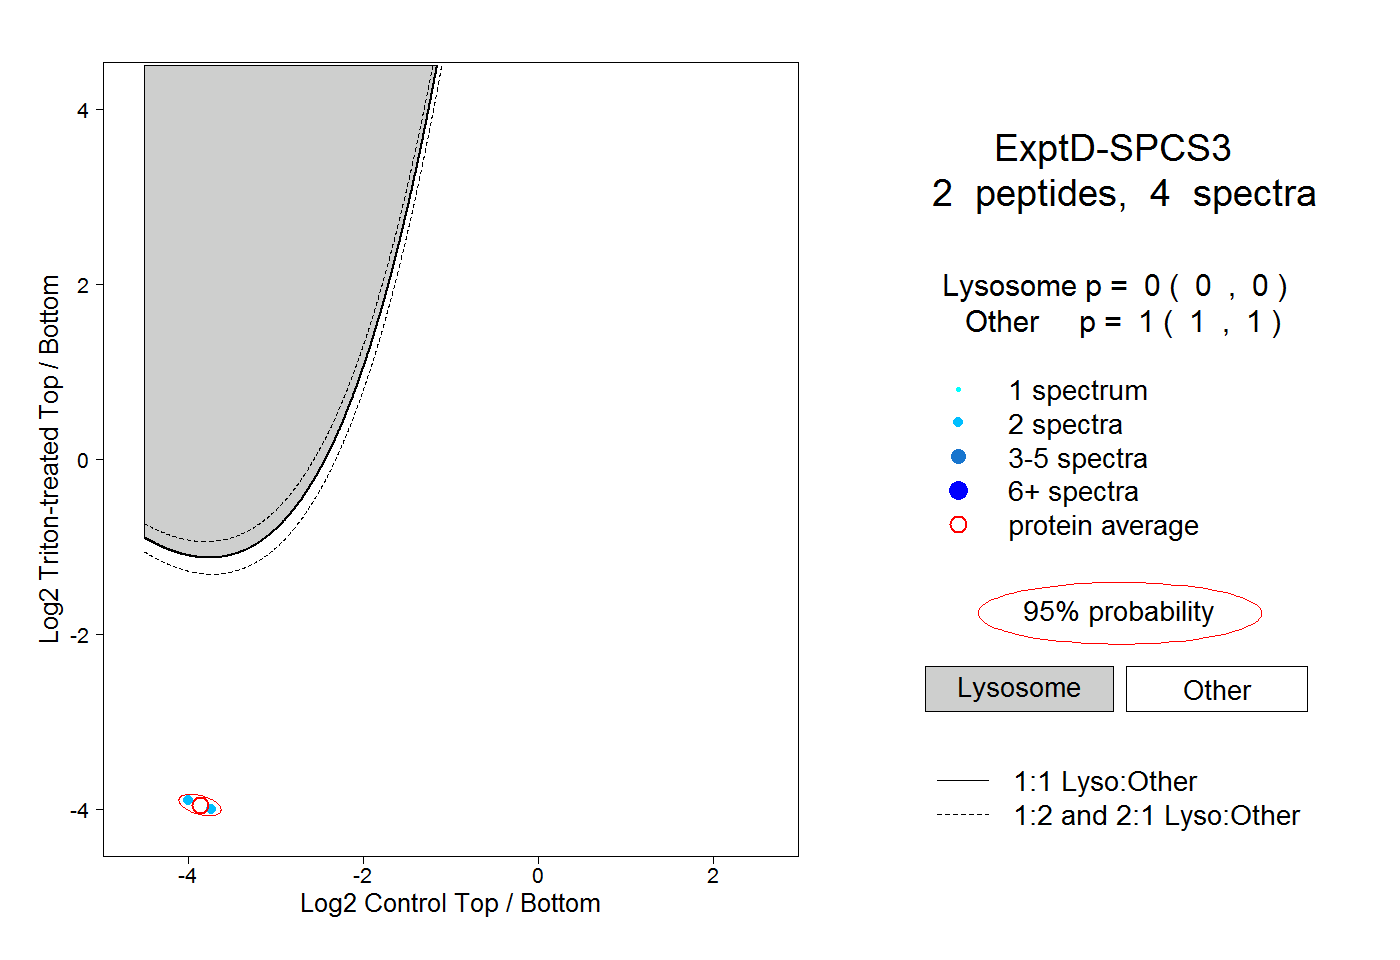
| | | Plot |
|
Lyso |
|
|
|
|
|
|
|
Other |
| Expt D |
2
peptides |
4
spectra |
 |
|
0.000
0.000 | 0.000 |
|
|
|
|
|
|
|
1.000
1.000 | 1.000 |