 5
5peptides
spectra
0.000 | 0.000
0.000 | 0.000
0.053 | 0.070
0.929 | 0.945
0.000 | 0.000
0.000 | 0.000
0.000 | 0.000
0.000 | 0.000
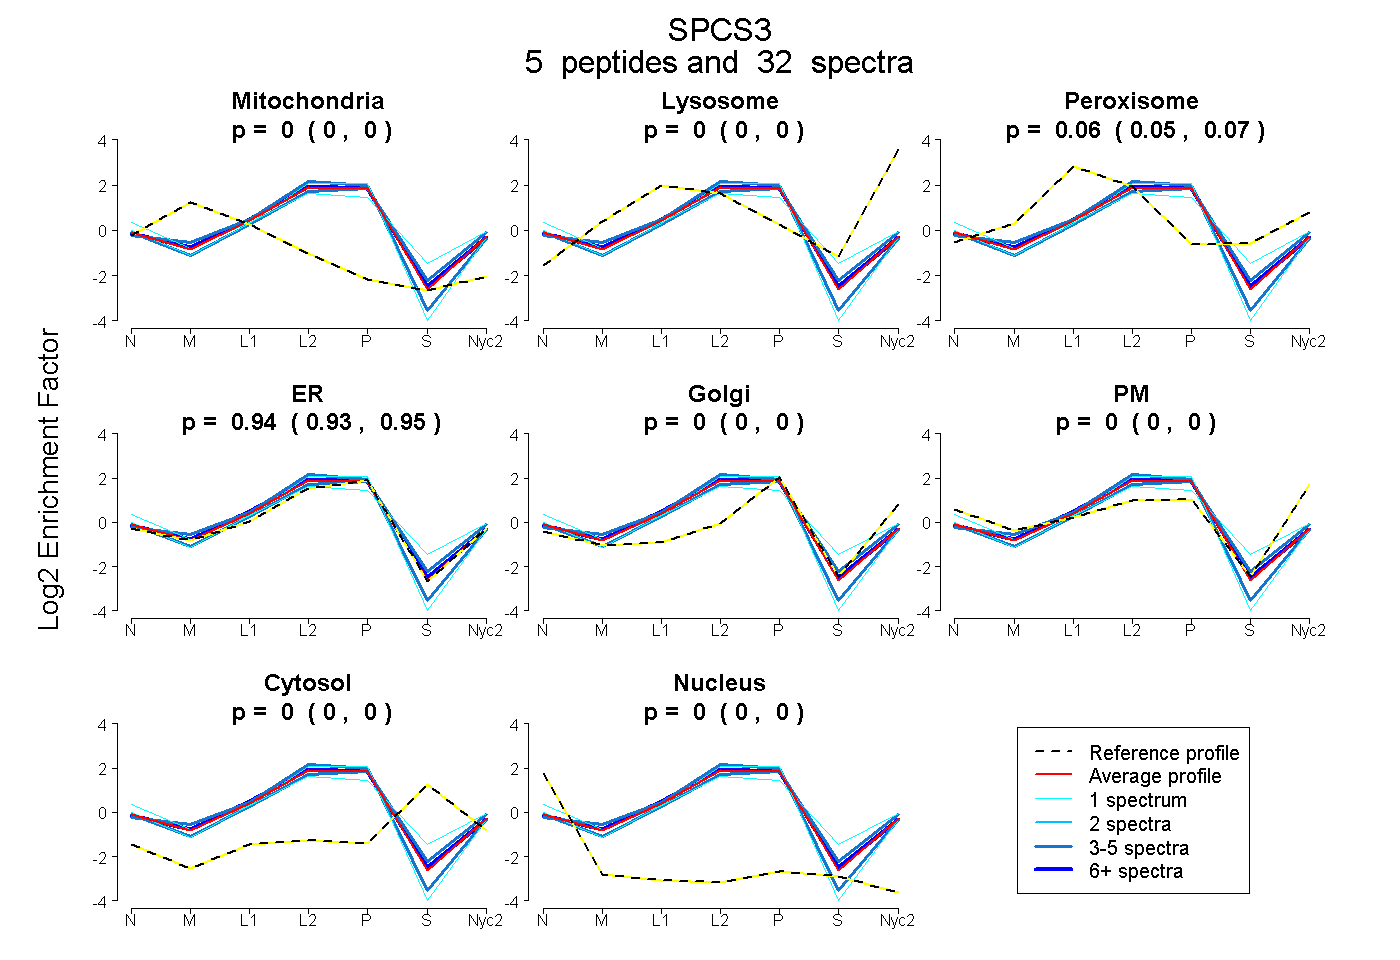
| Plot | Mito | Lyso | Perox | ER | Golgi | PM | Cytosol | Nucleus | |||||
| Expt A |
5 peptides |
32 spectra |
|
0.000 0.000 | 0.000 |
0.000 0.000 | 0.000 |
0.062 0.053 | 0.070 |
0.938 0.929 | 0.945 |
0.000 0.000 | 0.000 |
0.000 0.000 | 0.000 |
0.000 0.000 | 0.000 |
0.000 0.000 | 0.000 |
| 4 spectra, NVEDFTGPR | 0.000 | 0.000 | 0.061 | 0.896 | 0.000 | 0.026 | 0.017 | 0.000 | ||
| 1 spectrum, YFFFDDGNGLK | 0.000 | 0.000 | 0.000 | 1.000 | 0.000 | 0.000 | 0.000 | 0.000 | ||
| 1 spectrum, QLFLYLSAEYSTK | 0.000 | 0.000 | 0.159 | 0.655 | 0.000 | 0.111 | 0.075 | 0.000 | ||
| 4 spectra, NNALNQVVLWDK | 0.000 | 0.000 | 0.000 | 1.000 | 0.000 | 0.000 | 0.000 | 0.000 | ||
| 22 spectra, MNTVLSR | 0.000 | 0.000 | 0.086 | 0.914 | 0.000 | 0.000 | 0.000 | 0.000 |
| Plot | Mito | Lyso or Perox | ER | Golgi | PM | Cytosol | Nucleus | ||||||
| Expt B |
3 peptides |
16 spectra |
 |
0.000 0.000 | 0.000 |
0.132 0.110 | 0.149 |
0.833 0.798 | 0.860 |
0.000 0.000 | 0.000 |
0.024 0.000 | 0.050 |
0.011 0.000 | 0.028 |
0.000 0.000 | 0.000 |
|||
| Plot | Lyso | Other | |||||||||||
| Expt C |
4 peptides |
27 spectra |
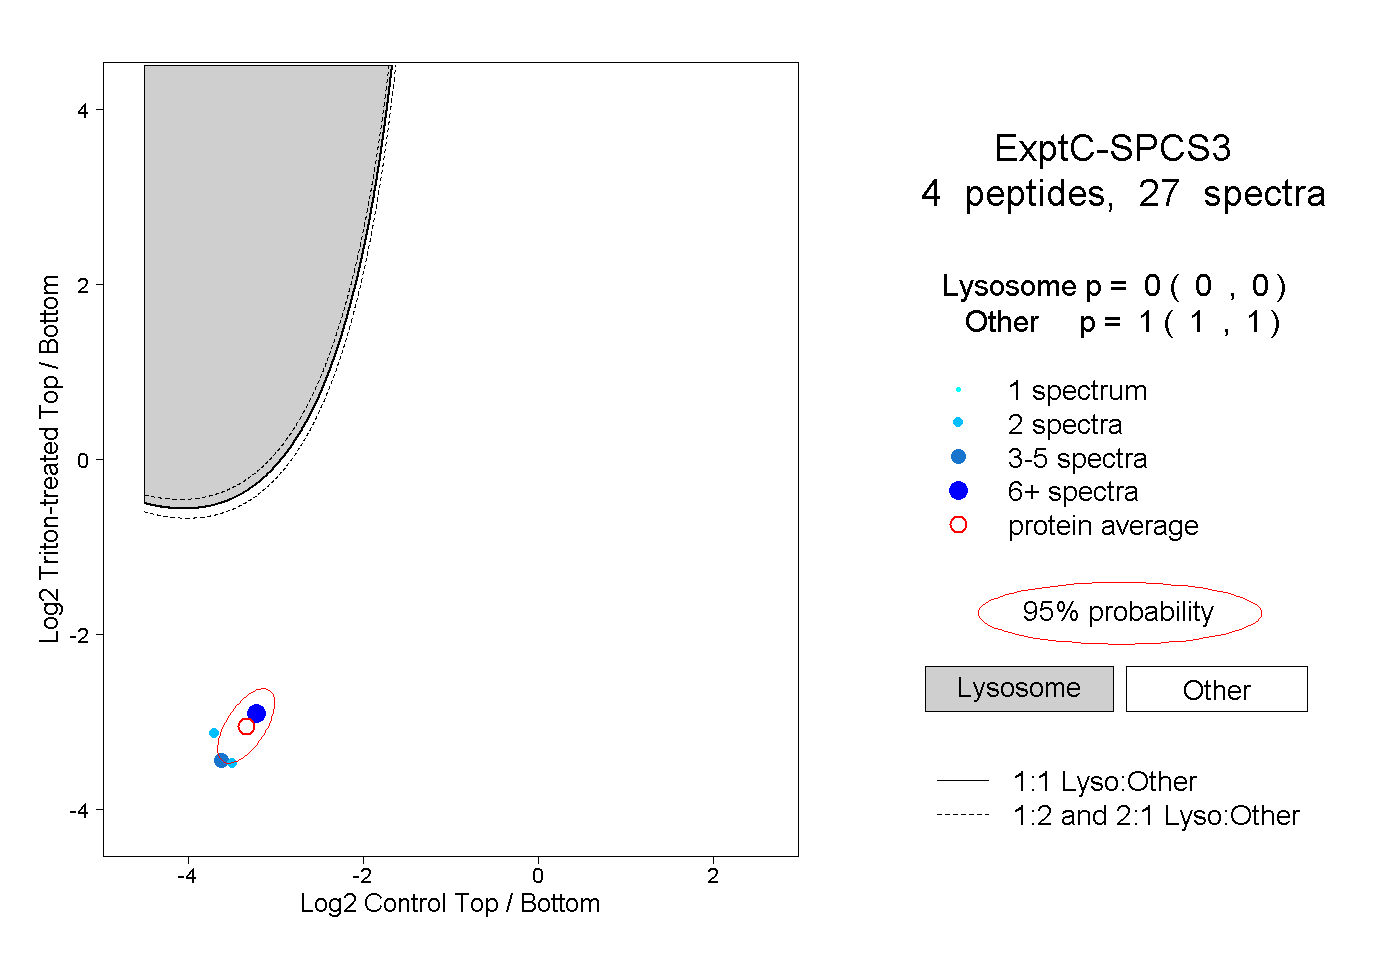 |
0.000 0.000 | 0.000 |
1.000 1.000 | 1.000 |
||||||||
| Plot | Lyso | Other | |||||||||||
| Expt D |
2 peptides |
4 spectra |
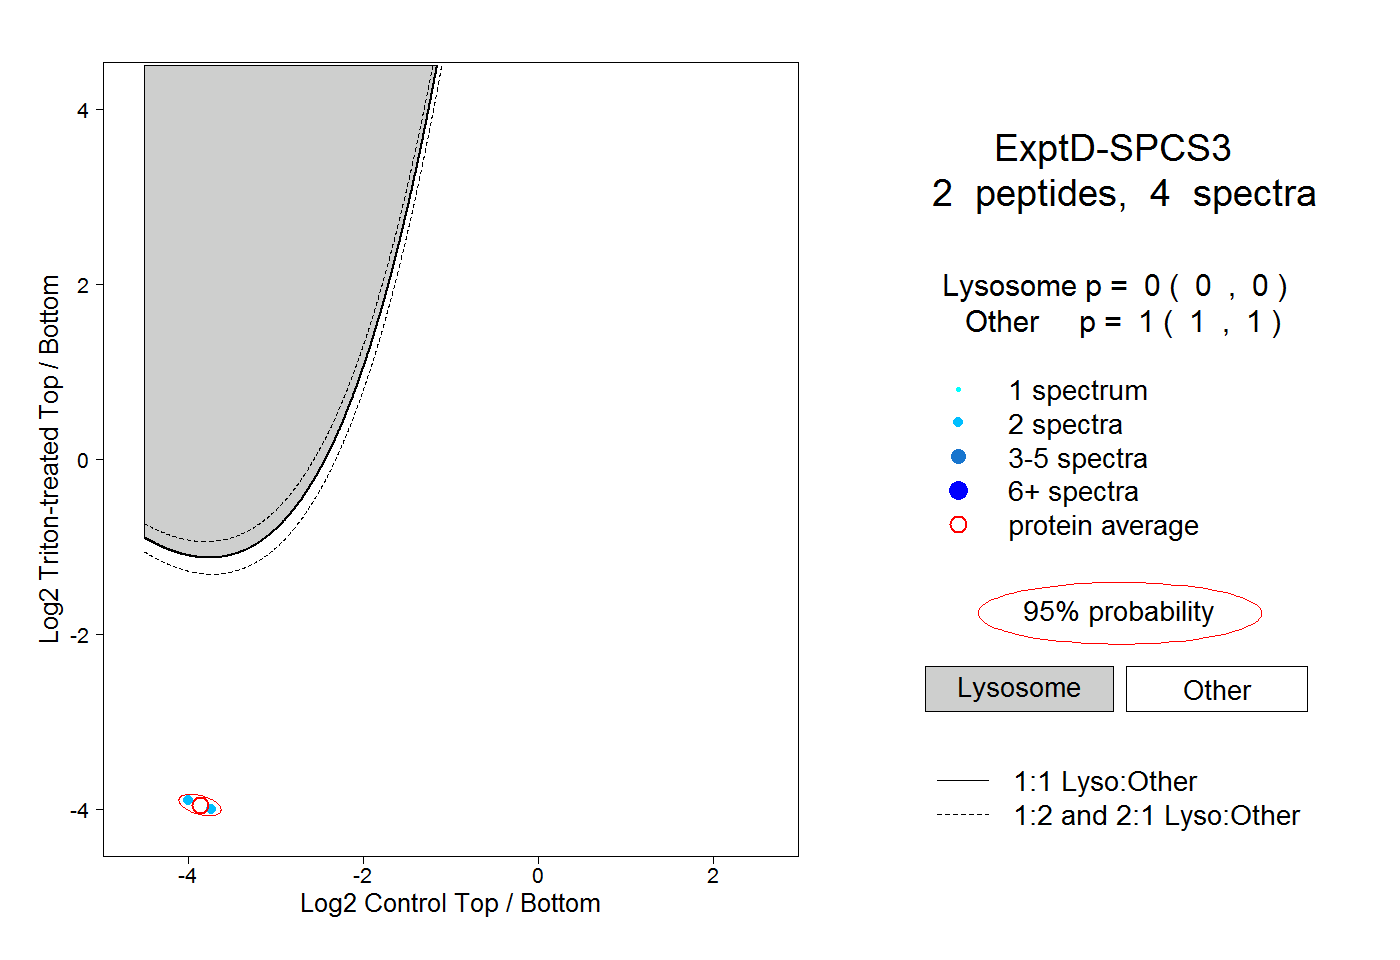 |
0.000 0.000 | 0.000 |
1.000 1.000 | 1.000 |