 32
32peptides
spectra
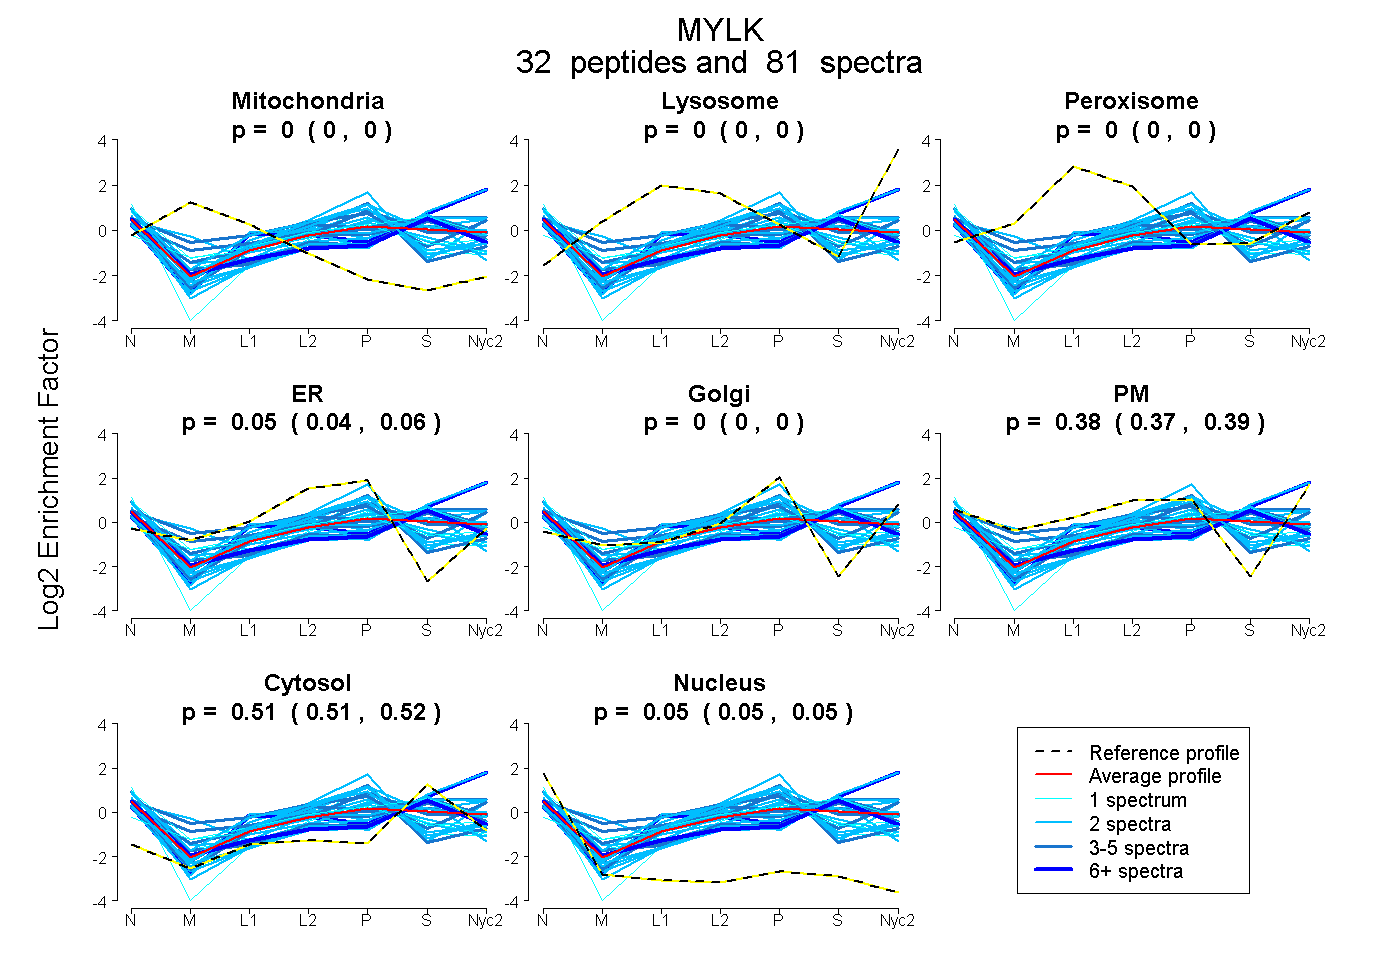
0.000 | 0.000
0.000 | 0.000
0.000 | 0.000
0.040 | 0.060
0.000 | 0.000
0.373 | 0.394
0.508 | 0.517
0.048 | 0.054
11peptides
spectra
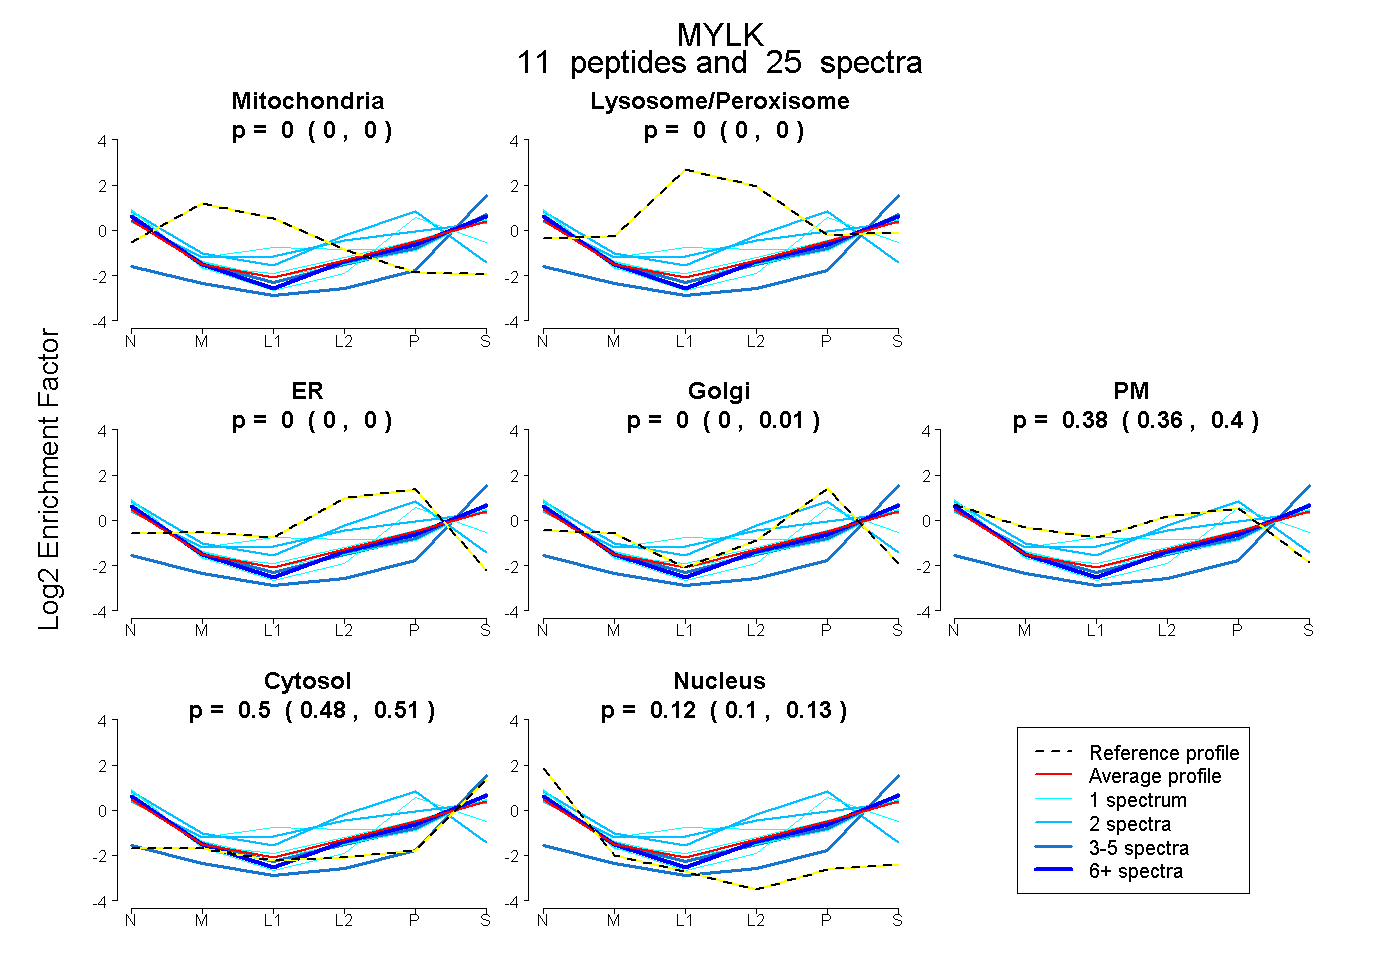
0.000 | 0.000
0.000 | 0.000
0.000 | 0.000
0.000 | 0.010
0.364 | 0.396
0.480 | 0.513
0.101 | 0.133
33peptides
spectra
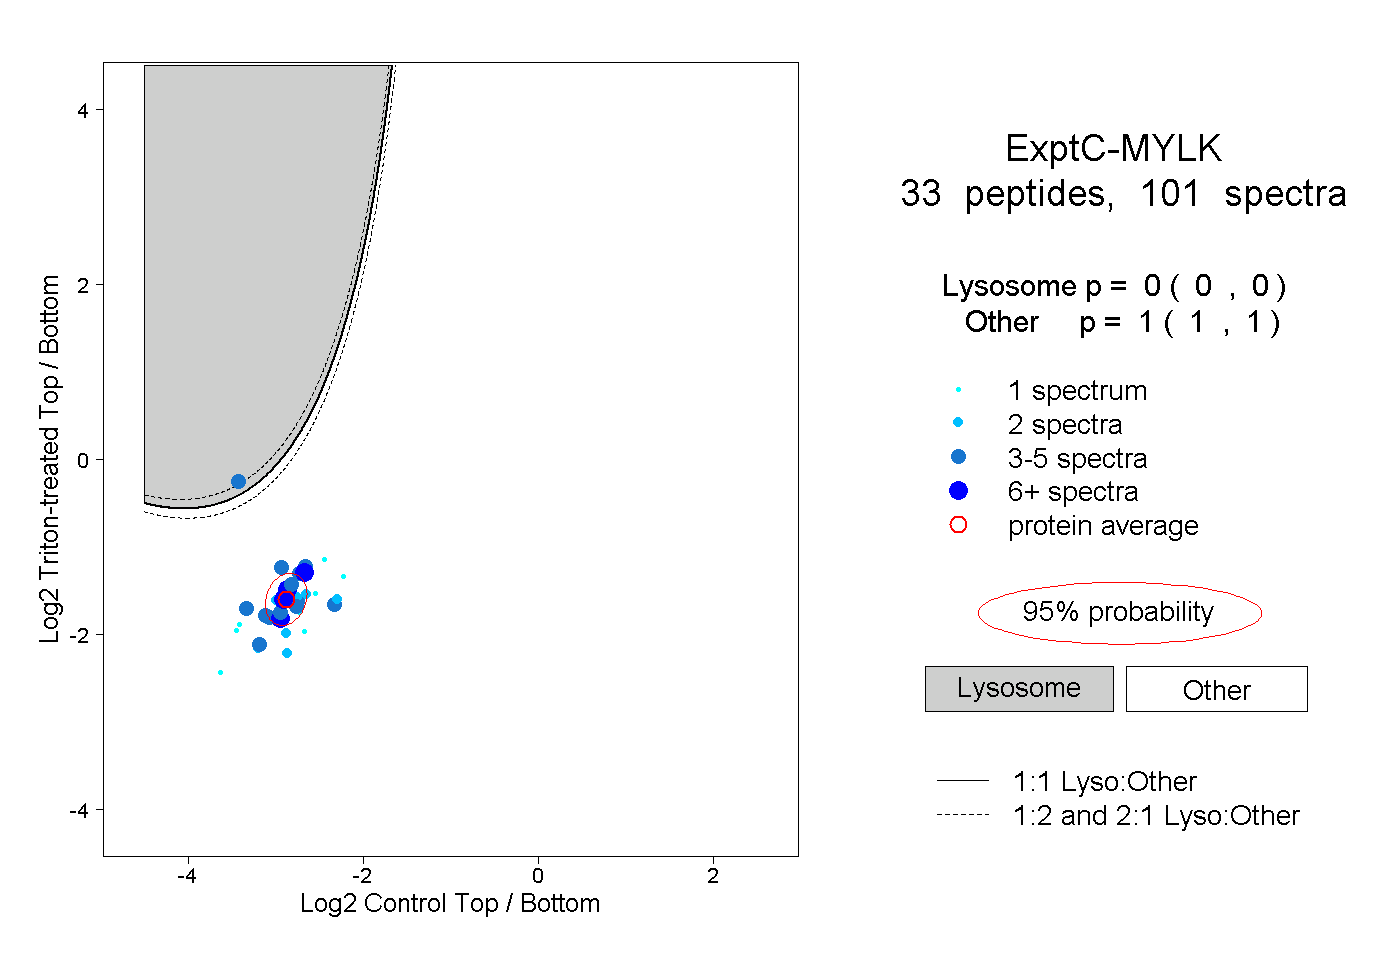
0.000 | 0.000
1.000 | 1.000
5peptides
spectra

0.000 | 0.177
0.821 | 1.000