MYLK
[ENSRNOP00000062274]
Main page
| | | Plot |
Mito |
Lyso |
|
Perox |
ER |
Golgi |
PM |
Cytosol |
Nucleus |
|
| Expt A |
 32
32
peptides |
81
spectra |
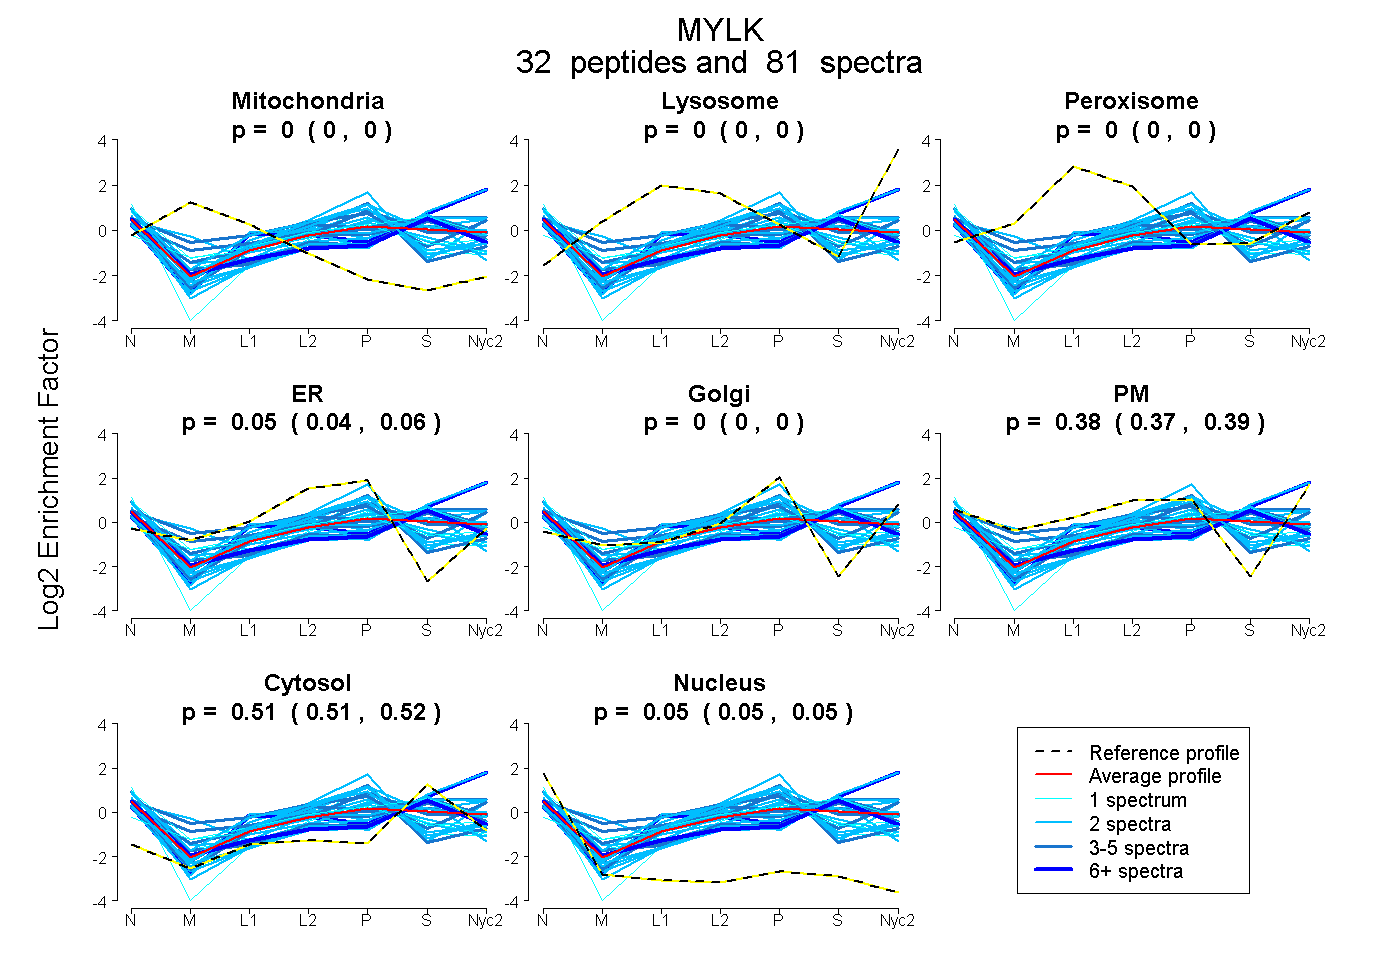 |
0.000
0.000 | 0.000 |
0.000
0.000 | 0.000 |
|
0.000
0.000 | 0.000 |
0.051
0.040 | 0.060 |
0.000
0.000 | 0.000 |
0.385
0.373 | 0.394 |
0.513
0.508 | 0.517 |
0.052
0.048 | 0.054 |
|
| | | Plot |
Mito |
|
Lyso or Perox |
|
ER |
Golgi |
PM |
Cytosol |
Nucleus |
|
| Expt B |
11
peptides |
25
spectra |
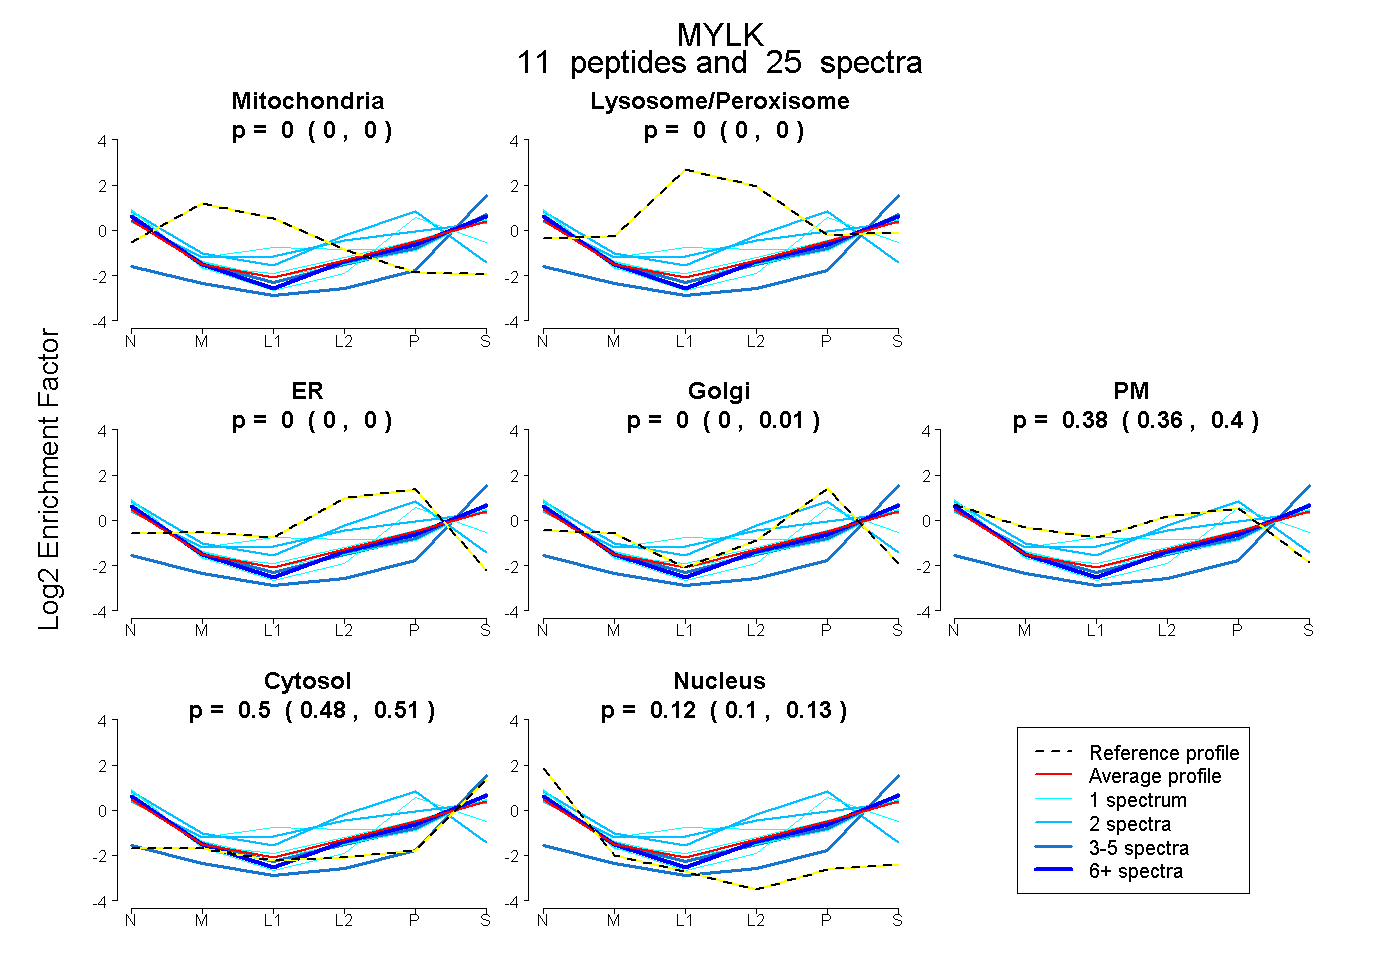 |
0.000
0.000 | 0.000 |
|
0.000
0.000 | 0.000 |
|
0.000
0.000 | 0.000 |
0.000
0.000 | 0.010 |
0.384
0.364 | 0.396 |
0.498
0.480 | 0.513 |
0.118
0.101 | 0.133 |
|
| 6 spectra, VSDVYDIEER |
0.000 |
|
0.000 |
|
0.000 |
0.002 |
0.314 |
0.531 |
0.153 |
|
| 5 spectra, IIDFGLAR |
0.000 |
|
0.000 |
|
0.000 |
0.000 |
0.000 |
0.962 |
0.038 |
|
| 1 spectrum, DLEVVEGSAAR |
0.000 |
|
0.283 |
|
0.000 |
0.000 |
0.141 |
0.432 |
0.144 |
|
| 1 spectrum, QATPPTR |
0.000 |
|
0.000 |
|
0.000 |
0.555 |
0.000 |
0.184 |
0.261 |
|
| 4 spectra, LTILAAR |
0.000 |
|
0.000 |
|
0.000 |
0.000 |
0.295 |
0.548 |
0.157 |
|
| 1 spectrum, ALPEDR |
0.000 |
|
0.000 |
|
0.000 |
0.000 |
0.410 |
0.474 |
0.116 |
|
| 2 spectra, QIQESENIR |
0.000 |
|
0.089 |
|
0.000 |
0.000 |
0.509 |
0.402 |
0.000 |
|
| 1 spectrum, LQDVHVAEGEK |
0.000 |
|
0.000 |
|
0.000 |
0.000 |
0.333 |
0.466 |
0.201 |
|
| 1 spectrum, LVQCVDAFEEK |
0.000 |
|
0.000 |
|
0.000 |
0.000 |
0.310 |
0.526 |
0.165 |
|
| 2 spectra, FLLDGGVR |
0.000 |
|
0.000 |
|
0.000 |
0.281 |
0.633 |
0.033 |
0.054 |
|
| 1 spectrum, FGQVFR |
0.000 |
|
0.000 |
|
0.000 |
0.000 |
0.338 |
0.529 |
0.132 |
|
| | | Plot |
|
Lyso |
|
|
|
|
|
|
|
Other |
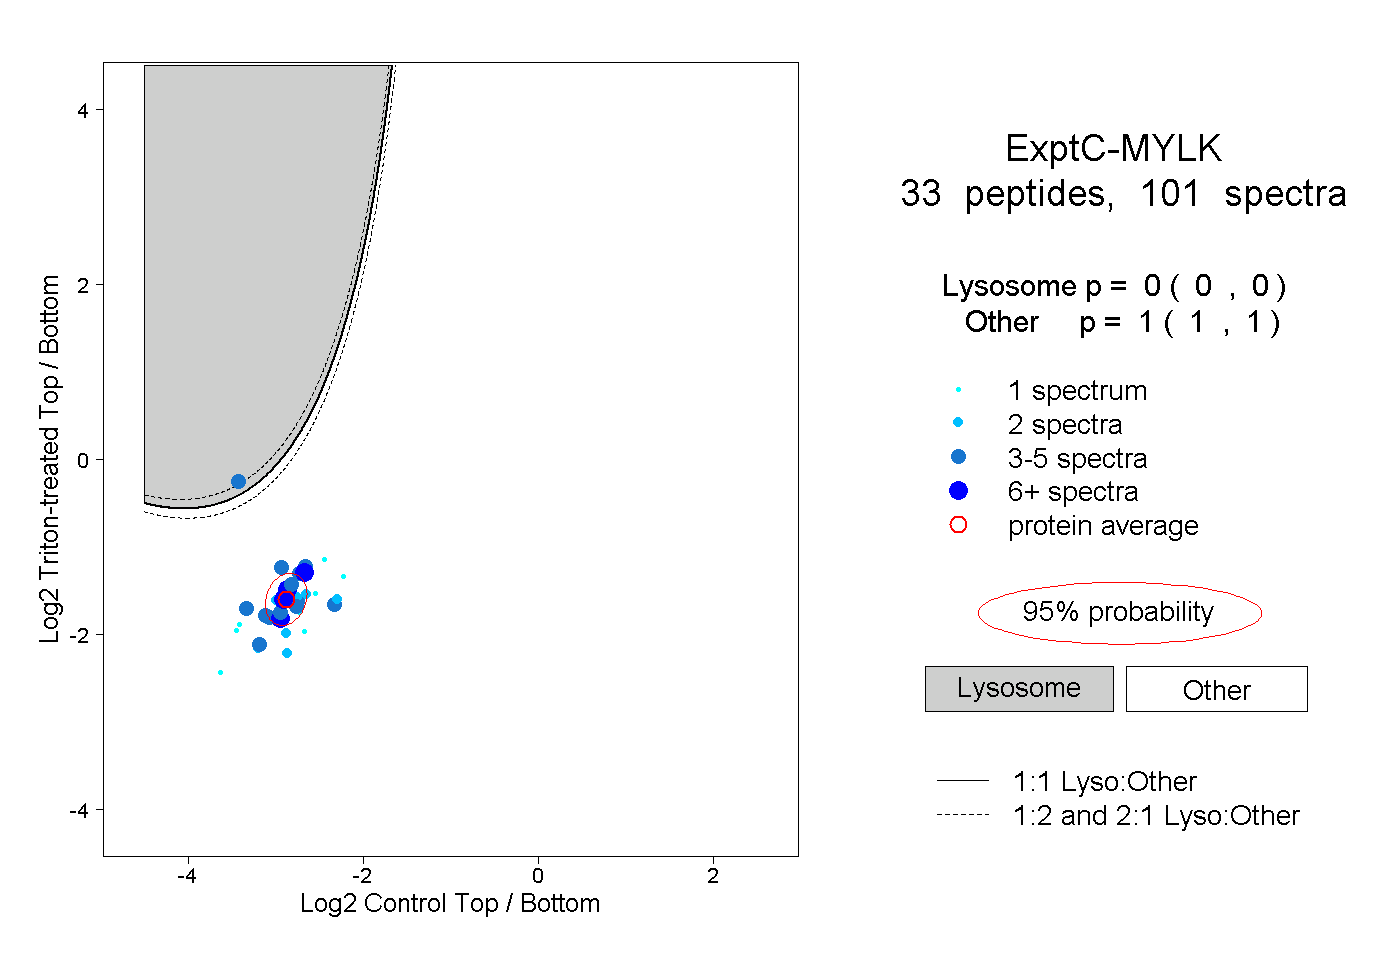
| Expt C |
33
peptides |
101
spectra |
 |
|
0.000
0.000 | 0.000 |
|
|
|
|
|
|
|
1.000
1.000 | 1.000 |
| | | Plot |
|
Lyso |
|
|
|
|
|
|
|
Other |
| Expt D |
5
peptides |
18
spectra |
 |
|
0.000
0.000 | 0.177 |
|
|
|
|
|
|
|
1.000
0.821 | 1.000 |