 23
23peptides
spectra
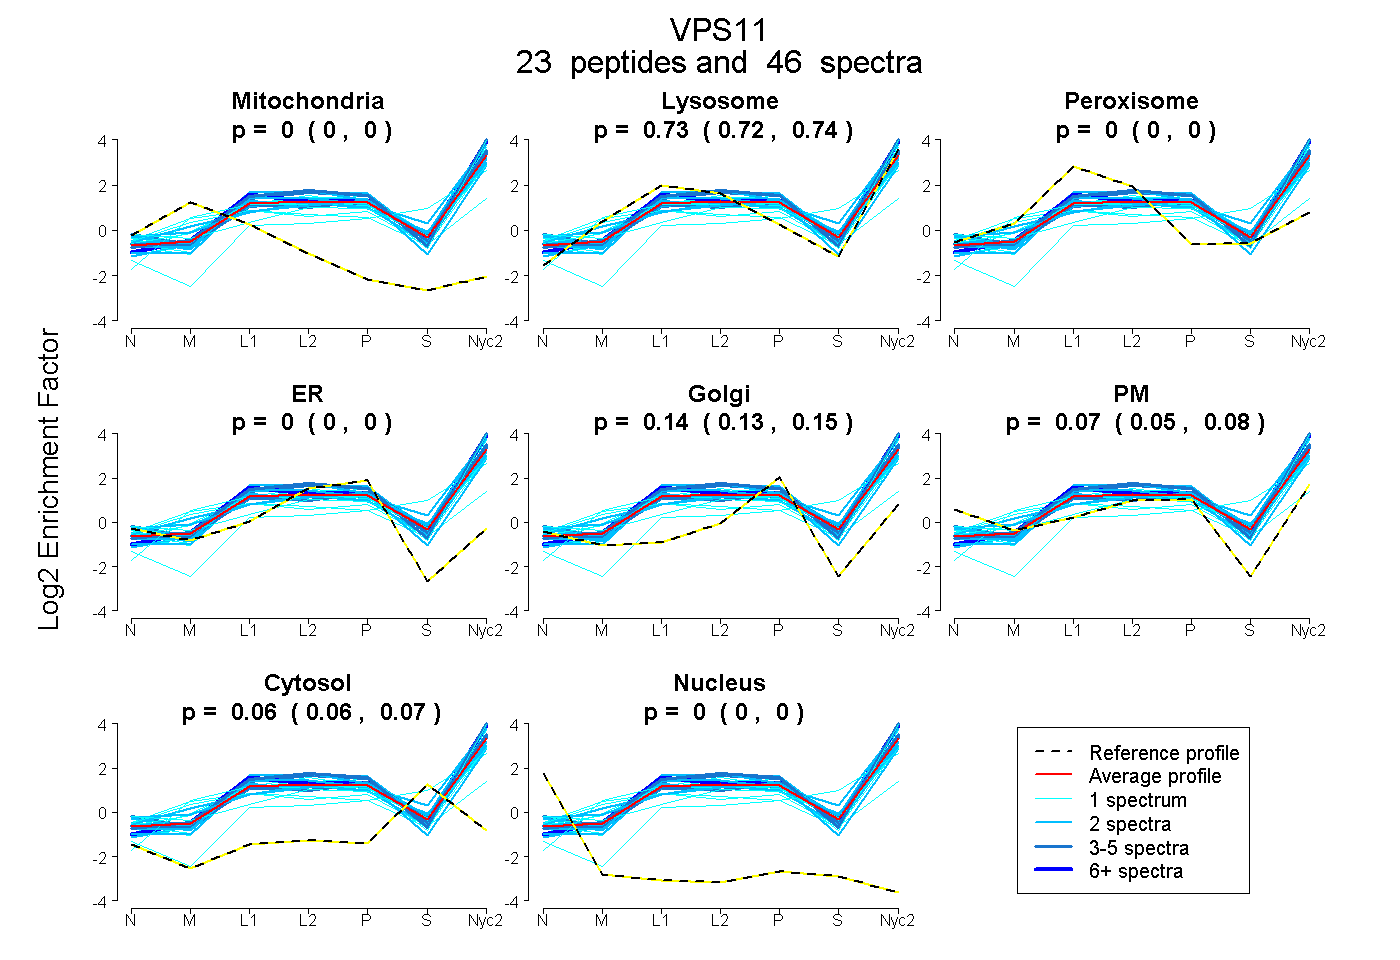
0.000 | 0.000
0.724 | 0.738
0.000 | 0.000
0.000 | 0.000
0.128 | 0.148
0.052 | 0.078
0.059 | 0.067
0.000 | 0.000
8peptides
spectra
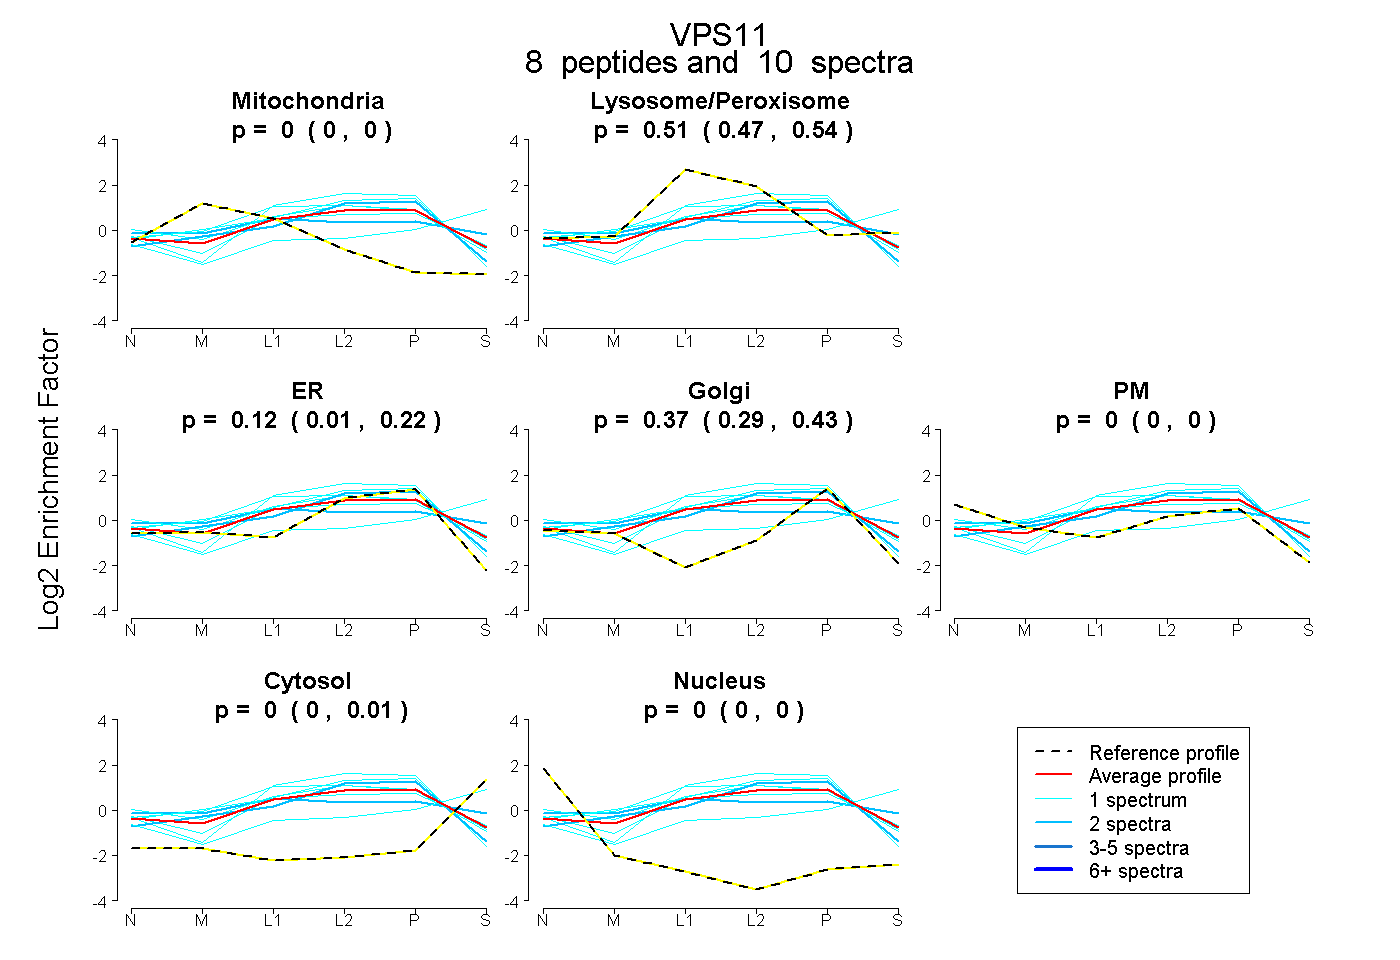
0.000 | 0.000
0.466 | 0.538
0.010 | 0.216
0.287 | 0.429
0.000 | 0.000
0.000 | 0.015
0.000 | 0.000
36peptides
spectra
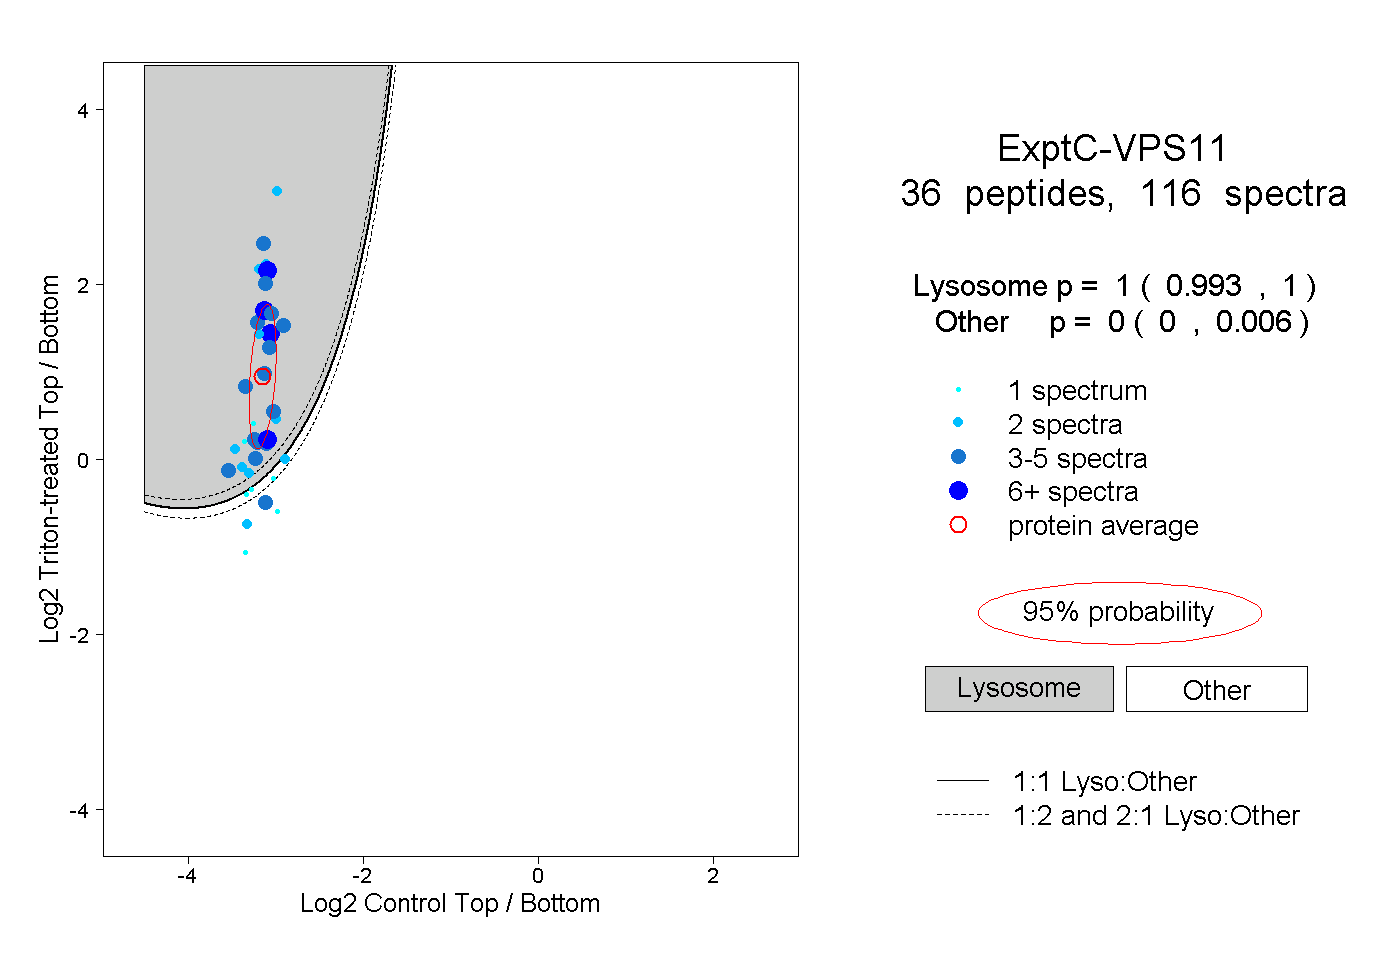
0.993 | 1.000
0.000 | 0.006
6peptides
spectra
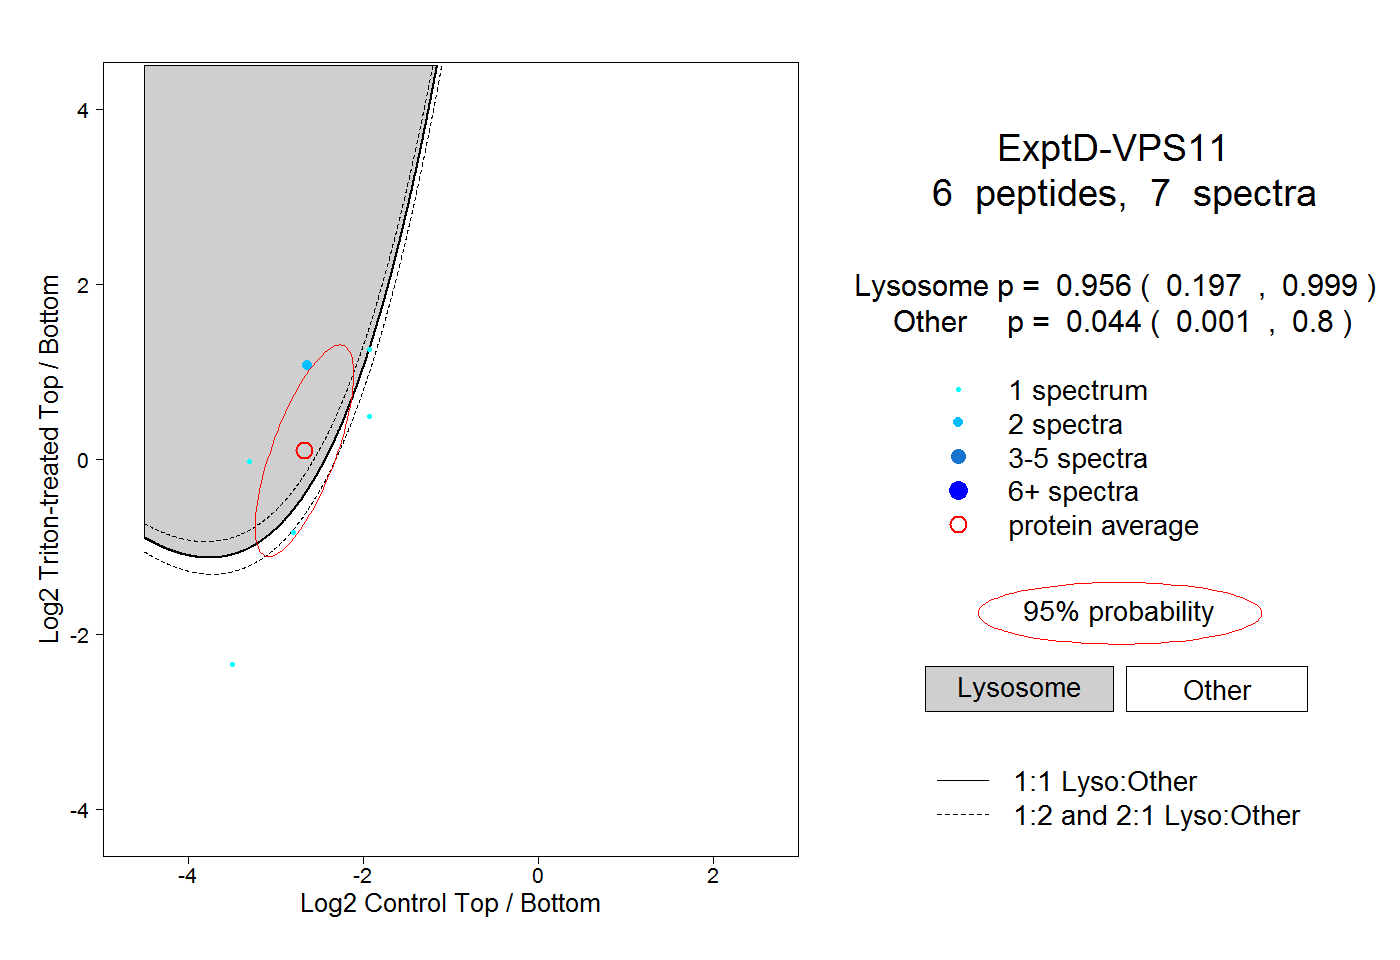
0.197 | 0.999
0.001 | 0.800