VPS11
[ENSRNOP00000061998]
Main page
| | | Plot |
Mito |
Lyso |
|
Perox |
ER |
Golgi |
PM |
Cytosol |
Nucleus |
|
| Expt A |
 23
23
peptides |
46
spectra |
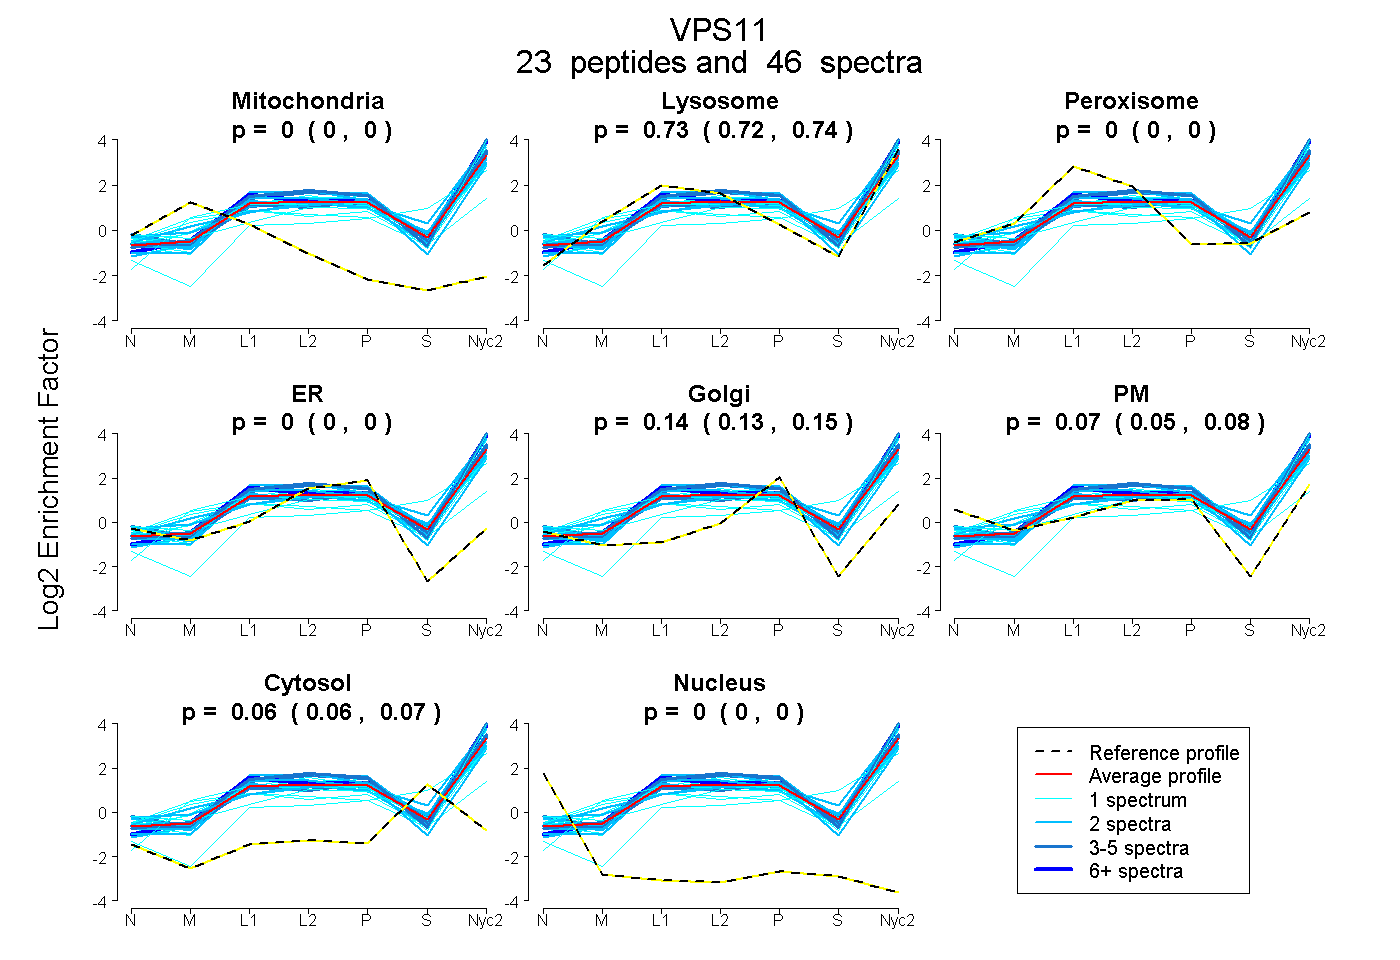 |
0.000
0.000 | 0.000 |
0.731
0.724 | 0.738 |
|
0.000
0.000 | 0.000 |
0.000
0.000 | 0.000 |
0.139
0.128 | 0.148 |
0.066
0.052 | 0.078 |
0.063
0.059 | 0.067 |
0.000
0.000 | 0.000 |
|
| | | Plot |
Mito |
|
Lyso or Perox |
|
ER |
Golgi |
PM |
Cytosol |
Nucleus |
|
| Expt B |
8
peptides |
10
spectra |
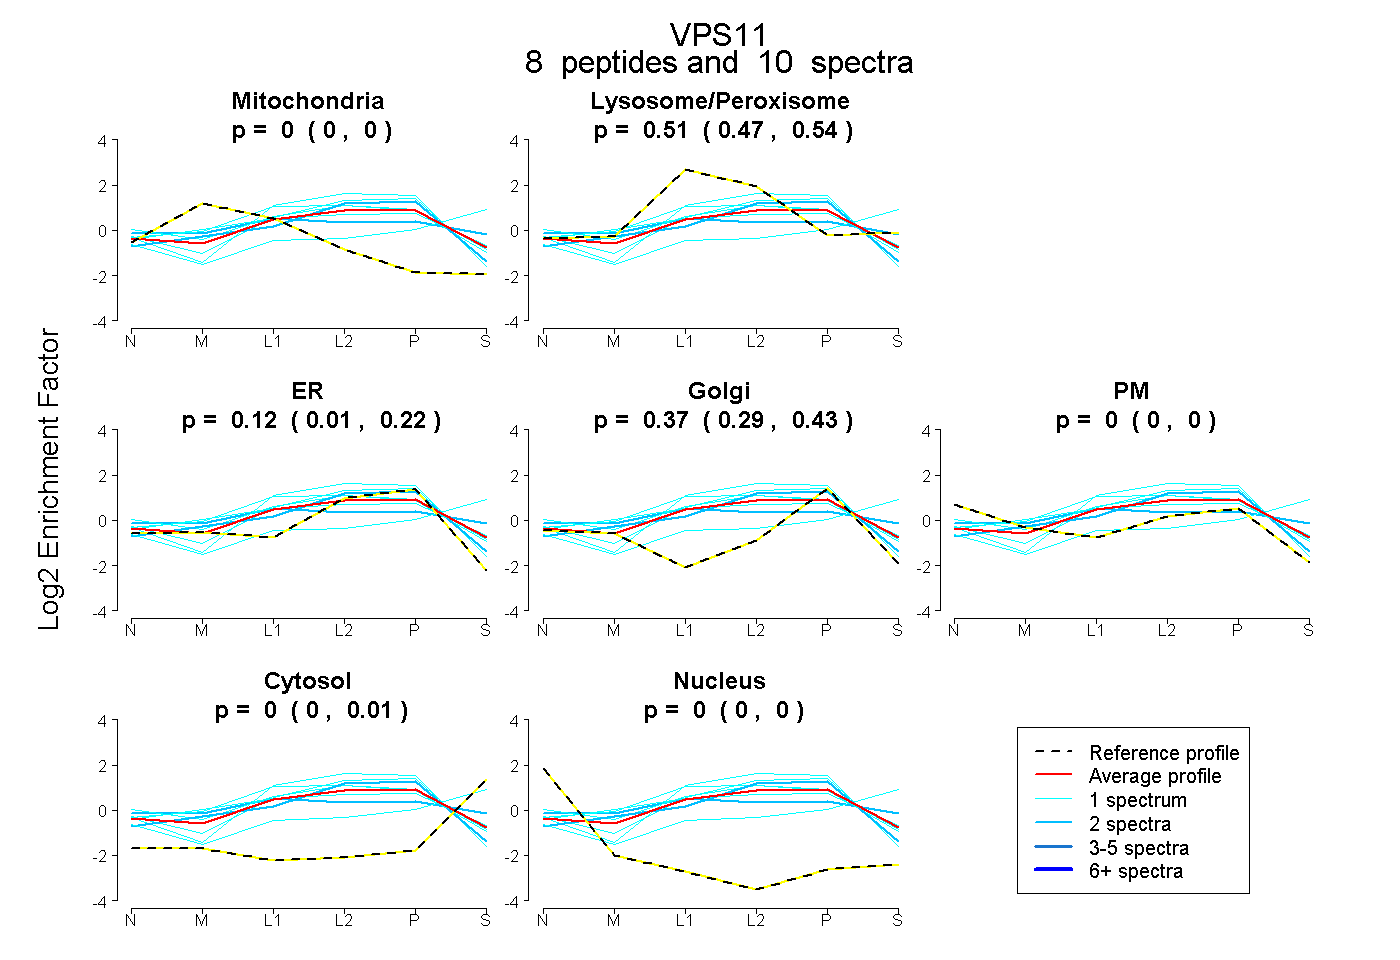 |
0.000
0.000 | 0.000 |
|
0.508
0.466 | 0.538 |
|
0.125
0.010 | 0.216 |
0.367
0.287 | 0.429 |
0.000
0.000 | 0.000 |
0.000
0.000 | 0.015 |
0.000
0.000 | 0.000 |
|
| 2 spectra, LEPSYVIR |
0.000 |
|
0.276 |
|
0.695 |
0.029 |
0.000 |
0.000 |
0.000 |
|
| 1 spectrum, IWNLEK |
0.000 |
|
0.463 |
|
0.214 |
0.150 |
0.172 |
0.000 |
0.000 |
|
| 2 spectra, DLHDQFQHQLK |
0.000 |
|
0.509 |
|
0.000 |
0.248 |
0.124 |
0.119 |
0.000 |
|
| 1 spectrum, FCDVFDK |
0.000 |
|
0.550 |
|
0.272 |
0.178 |
0.000 |
0.000 |
0.000 |
|
| 1 spectrum, LEEFLK |
0.000 |
|
0.399 |
|
0.601 |
0.000 |
0.000 |
0.000 |
0.000 |
|
| 1 spectrum, TQILHK |
0.000 |
|
0.552 |
|
0.000 |
0.448 |
0.000 |
0.000 |
0.000 |
|
| 1 spectrum, GSYPVTGLAFR |
0.000 |
|
0.325 |
|
0.675 |
0.000 |
0.000 |
0.000 |
0.000 |
|
| 1 spectrum, NYEEALR |
0.000 |
|
0.361 |
|
0.000 |
0.175 |
0.000 |
0.464 |
0.000 |
|
| | | Plot |
|
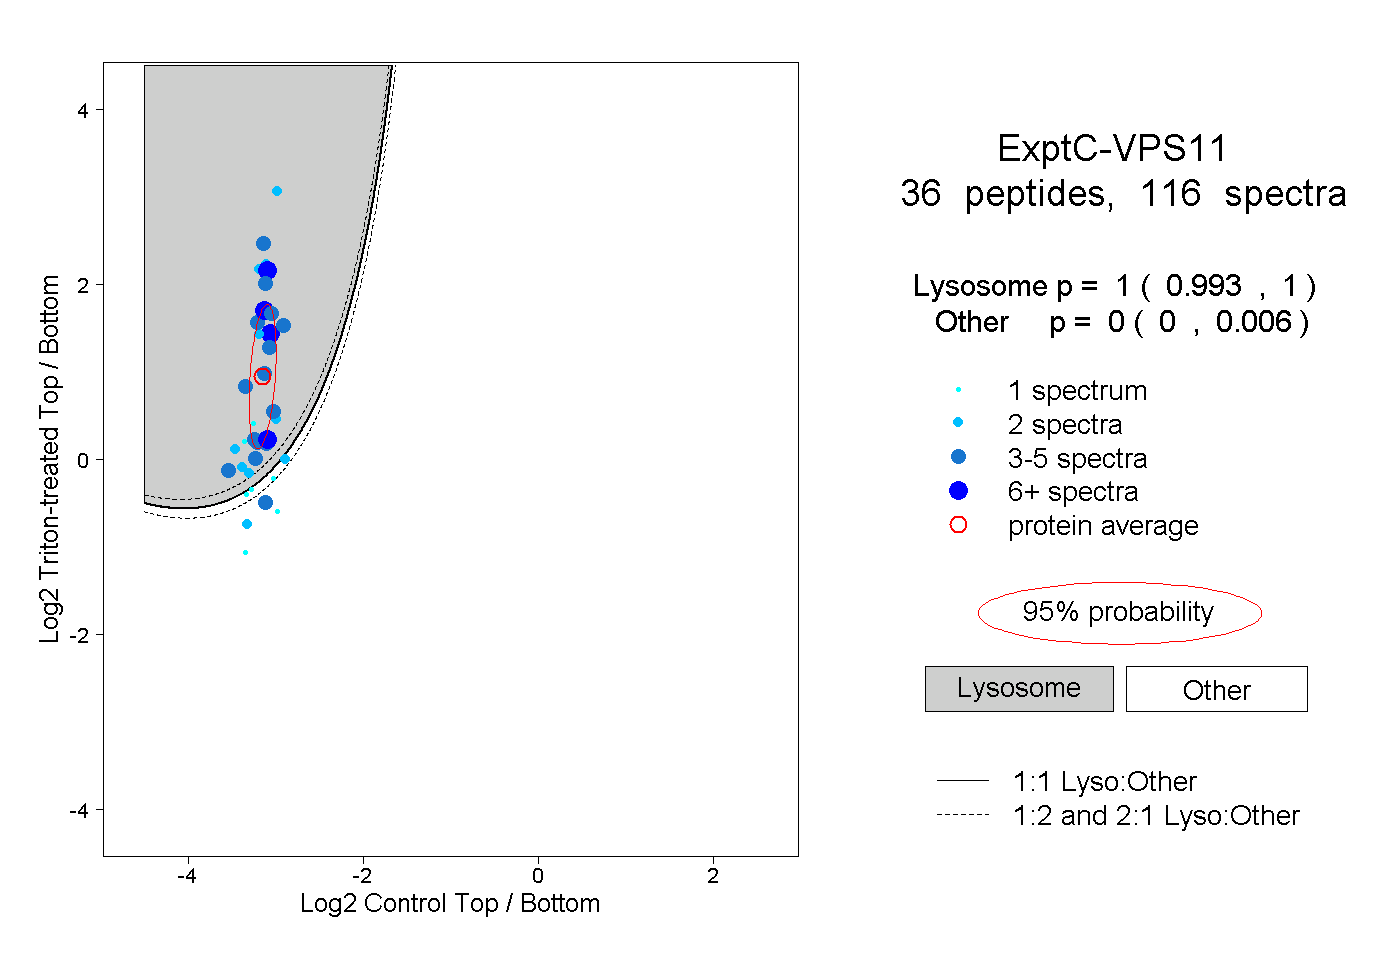
Lyso |
|
|
|
|
|
|
|
Other |
| Expt C |
36
peptides |
116
spectra |
 |
|
1.000
0.993 | 1.000 |
|
|
|
|
|
|
|
0.000
0.000 | 0.006 |
| | | Plot |
|
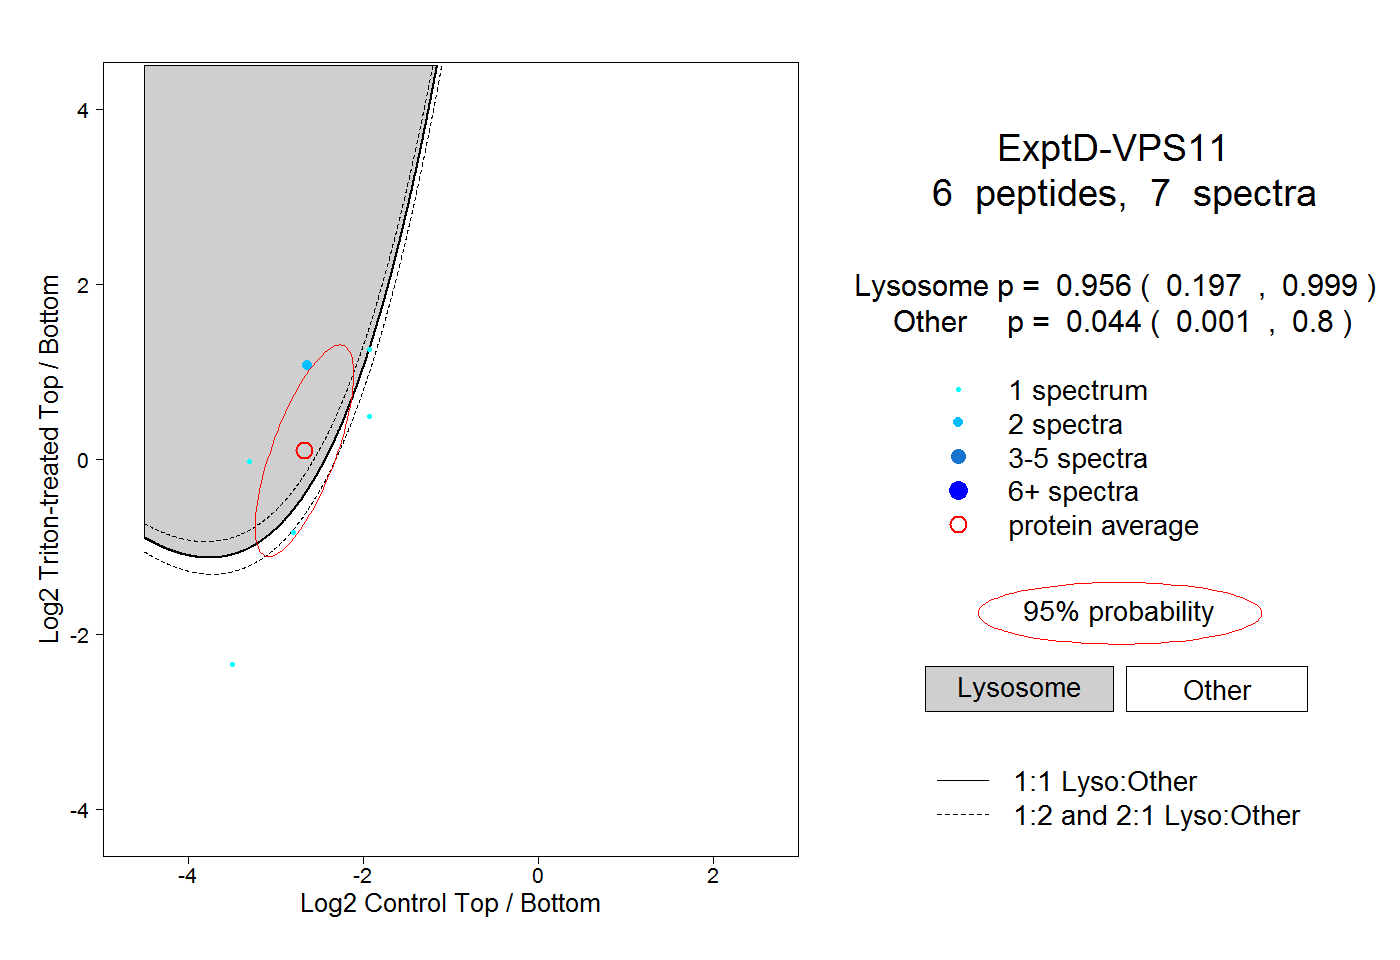
Lyso |
|
|
|
|
|
|
|
Other |
| Expt D |
6
peptides |
7
spectra |
 |
|
0.956
0.197 | 0.999 |
|
|
|
|
|
|
|
0.044
0.001 | 0.800 |