 23
23peptides
spectra
0.000 | 0.000
0.724 | 0.738
0.000 | 0.000
0.000 | 0.000
0.128 | 0.148
0.052 | 0.078
0.059 | 0.067
0.000 | 0.000
| Plot | Mito | Lyso | Perox | ER | Golgi | PM | Cytosol | Nucleus | |||||
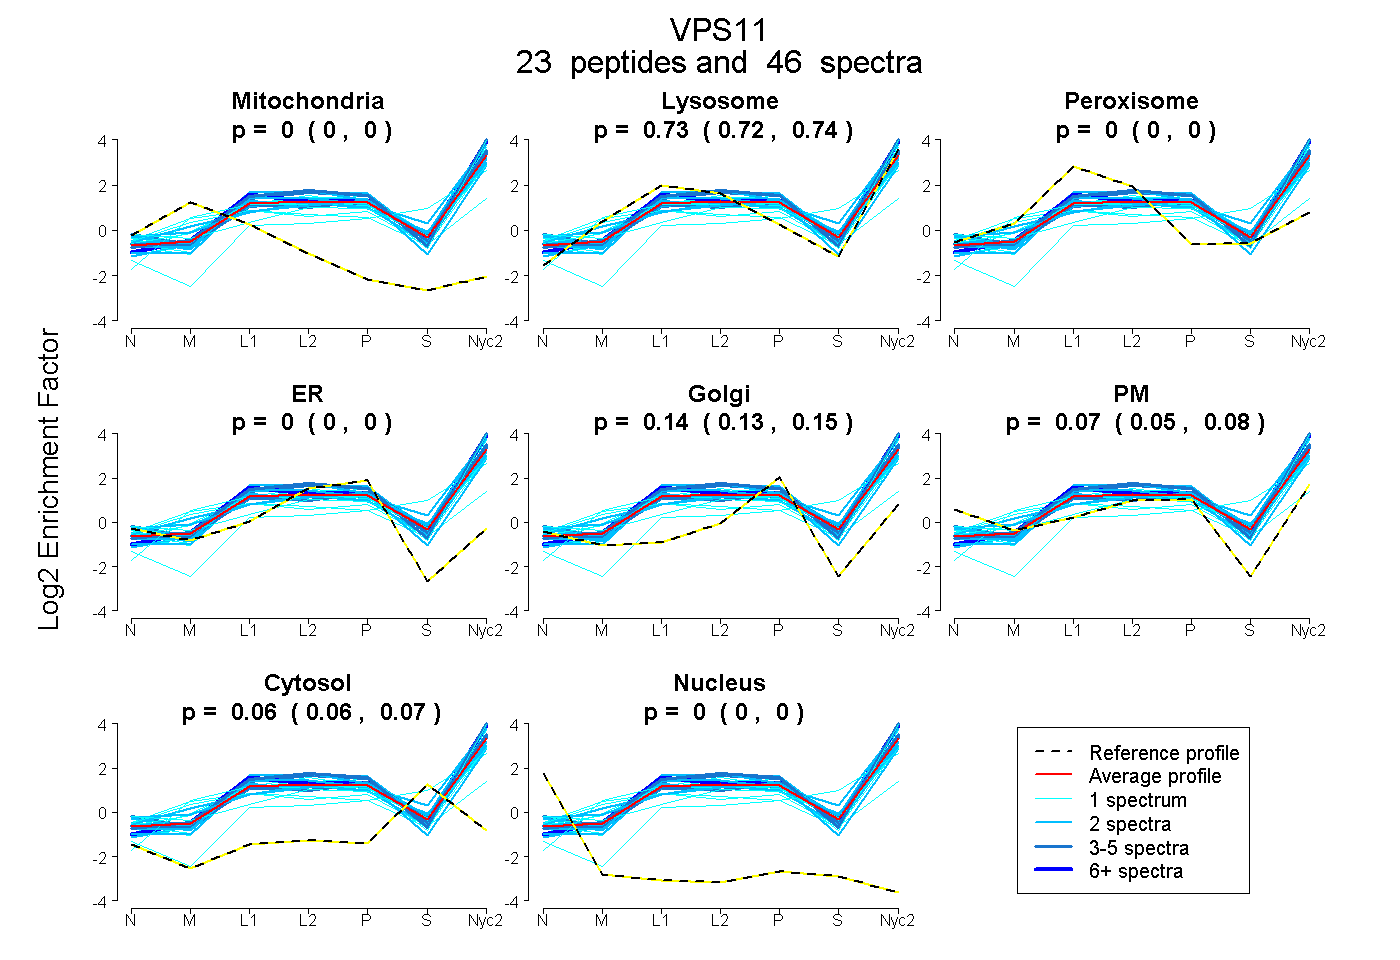
| Expt A |
23 peptides |
46 spectra |
|
0.000 0.000 | 0.000 |
0.731 0.724 | 0.738 |
0.000 0.000 | 0.000 |
0.000 0.000 | 0.000 |
0.139 0.128 | 0.148 |
0.066 0.052 | 0.078 |
0.063 0.059 | 0.067 |
0.000 0.000 | 0.000 |
| 3 spectra, LEPSYVIR | 0.000 | 0.735 | 0.000 | 0.000 | 0.190 | 0.000 | 0.075 | 0.000 | ||
| 1 spectrum, DSQNSDK | 0.000 | 0.854 | 0.000 | 0.000 | 0.119 | 0.000 | 0.027 | 0.000 | ||
| 1 spectrum, QILNIYDLCNK | 0.010 | 0.261 | 0.310 | 0.000 | 0.341 | 0.000 | 0.079 | 0.000 | ||
| 1 spectrum, CSNDSFSVIADYFGR | 0.000 | 0.789 | 0.000 | 0.000 | 0.153 | 0.053 | 0.005 | 0.000 | ||
| 2 spectra, GPCFAFEGHK | 0.000 | 0.682 | 0.000 | 0.000 | 0.068 | 0.171 | 0.079 | 0.000 | ||
| 2 spectra, LTLLTDPPTAR | 0.000 | 0.663 | 0.000 | 0.000 | 0.078 | 0.212 | 0.047 | 0.000 | ||
| 1 spectrum, SLQLTGFQAYK | 0.000 | 0.892 | 0.000 | 0.000 | 0.108 | 0.000 | 0.000 | 0.000 | ||
| 1 spectrum, FLDAQR | 0.000 | 0.615 | 0.000 | 0.000 | 0.000 | 0.288 | 0.097 | 0.000 | ||
| 1 spectrum, VHALQEK | 0.000 | 0.486 | 0.000 | 0.000 | 0.000 | 0.361 | 0.153 | 0.000 | ||
| 2 spectra, LHAEAISLLK | 0.000 | 0.856 | 0.000 | 0.000 | 0.078 | 0.038 | 0.028 | 0.000 | ||
| 2 spectra, ANSEEFIPIFANNPR | 0.000 | 0.893 | 0.000 | 0.000 | 0.107 | 0.000 | 0.000 | 0.000 | ||
| 1 spectrum, DLHDQFQHQLK | 0.000 | 0.671 | 0.000 | 0.000 | 0.055 | 0.230 | 0.044 | 0.000 | ||
| 2 spectra, VELDTHGCGLR | 0.000 | 0.519 | 0.000 | 0.000 | 0.148 | 0.331 | 0.001 | 0.000 | ||
| 1 spectrum, DLLMHSR | 0.000 | 0.751 | 0.000 | 0.000 | 0.183 | 0.000 | 0.065 | 0.000 | ||
| 3 spectra, FCDVFDK | 0.000 | 0.740 | 0.000 | 0.000 | 0.171 | 0.089 | 0.000 | 0.000 | ||
| 1 spectrum, LPFEQAESNMK | 0.000 | 0.666 | 0.000 | 0.000 | 0.062 | 0.182 | 0.091 | 0.000 | ||
| 1 spectrum, LTPSLEAGLQR | 0.000 | 0.523 | 0.000 | 0.000 | 0.000 | 0.000 | 0.477 | 0.000 | ||
| 4 spectra, QSQQIAQDELR | 0.000 | 0.832 | 0.000 | 0.000 | 0.091 | 0.077 | 0.000 | 0.000 | ||
| 2 spectra, IQLEDIK | 0.000 | 0.857 | 0.000 | 0.000 | 0.013 | 0.000 | 0.129 | 0.000 | ||
| 4 spectra, DGGNPLCTR | 0.000 | 0.627 | 0.000 | 0.000 | 0.000 | 0.310 | 0.062 | 0.000 | ||
| 2 spectra, ILMHHIPEQTTQLLK | 0.000 | 0.605 | 0.000 | 0.000 | 0.000 | 0.247 | 0.148 | 0.000 | ||
| 6 spectra, GSYPVTGLAFR | 0.000 | 0.873 | 0.000 | 0.000 | 0.109 | 0.000 | 0.018 | 0.000 | ||
| 2 spectra, GLCTDYRPSLEGR | 0.000 | 0.672 | 0.000 | 0.000 | 0.131 | 0.110 | 0.087 | 0.000 |
| Plot | Mito | Lyso or Perox | ER | Golgi | PM | Cytosol | Nucleus | ||||||
| Expt B |
8 peptides |
10 spectra |
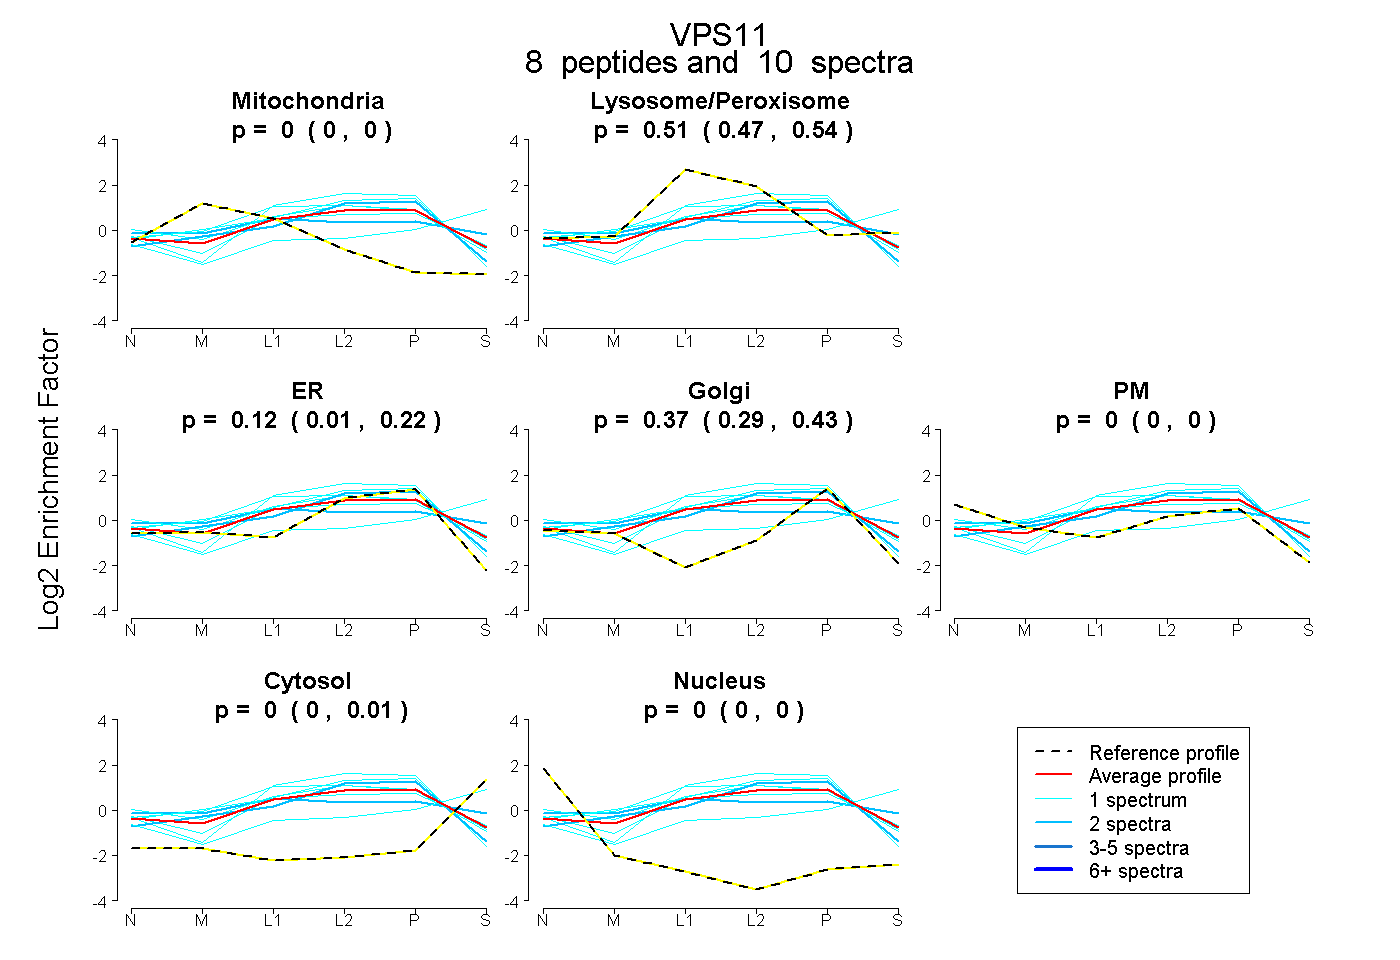 |
0.000 0.000 | 0.000 |
0.508 0.466 | 0.538 |
0.125 0.010 | 0.216 |
0.367 0.287 | 0.429 |
0.000 0.000 | 0.000 |
0.000 0.000 | 0.015 |
0.000 0.000 | 0.000 |
|||
| Plot | Lyso | Other | |||||||||||
| Expt C |
36 peptides |
116 spectra |
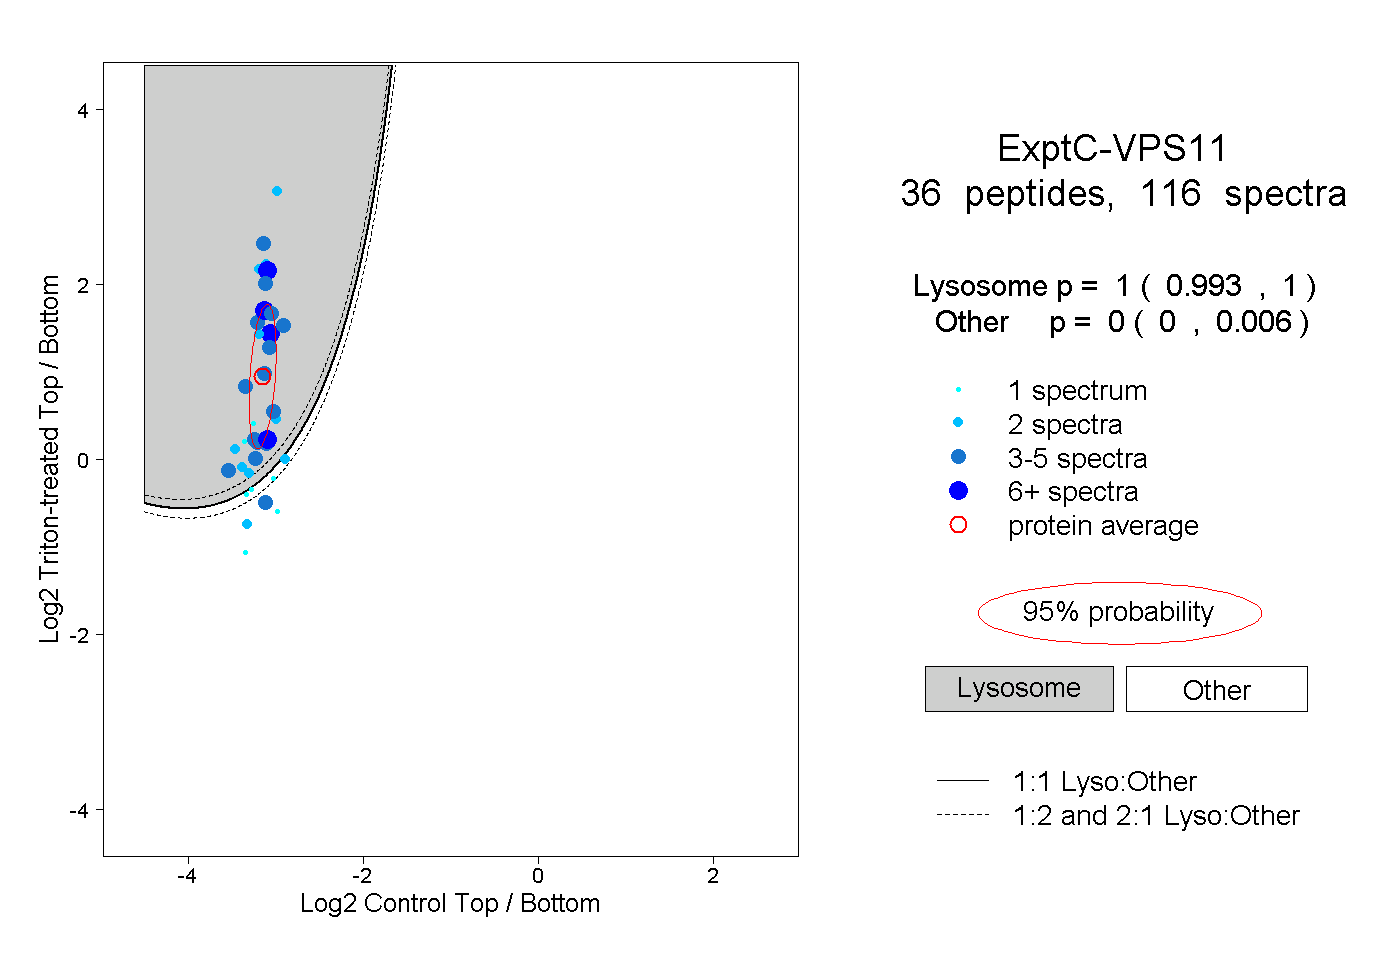 |
1.000 0.993 | 1.000 |
0.000 0.000 | 0.006 |
||||||||
| Plot | Lyso | Other | |||||||||||
| Expt D |
6 peptides |
7 spectra |
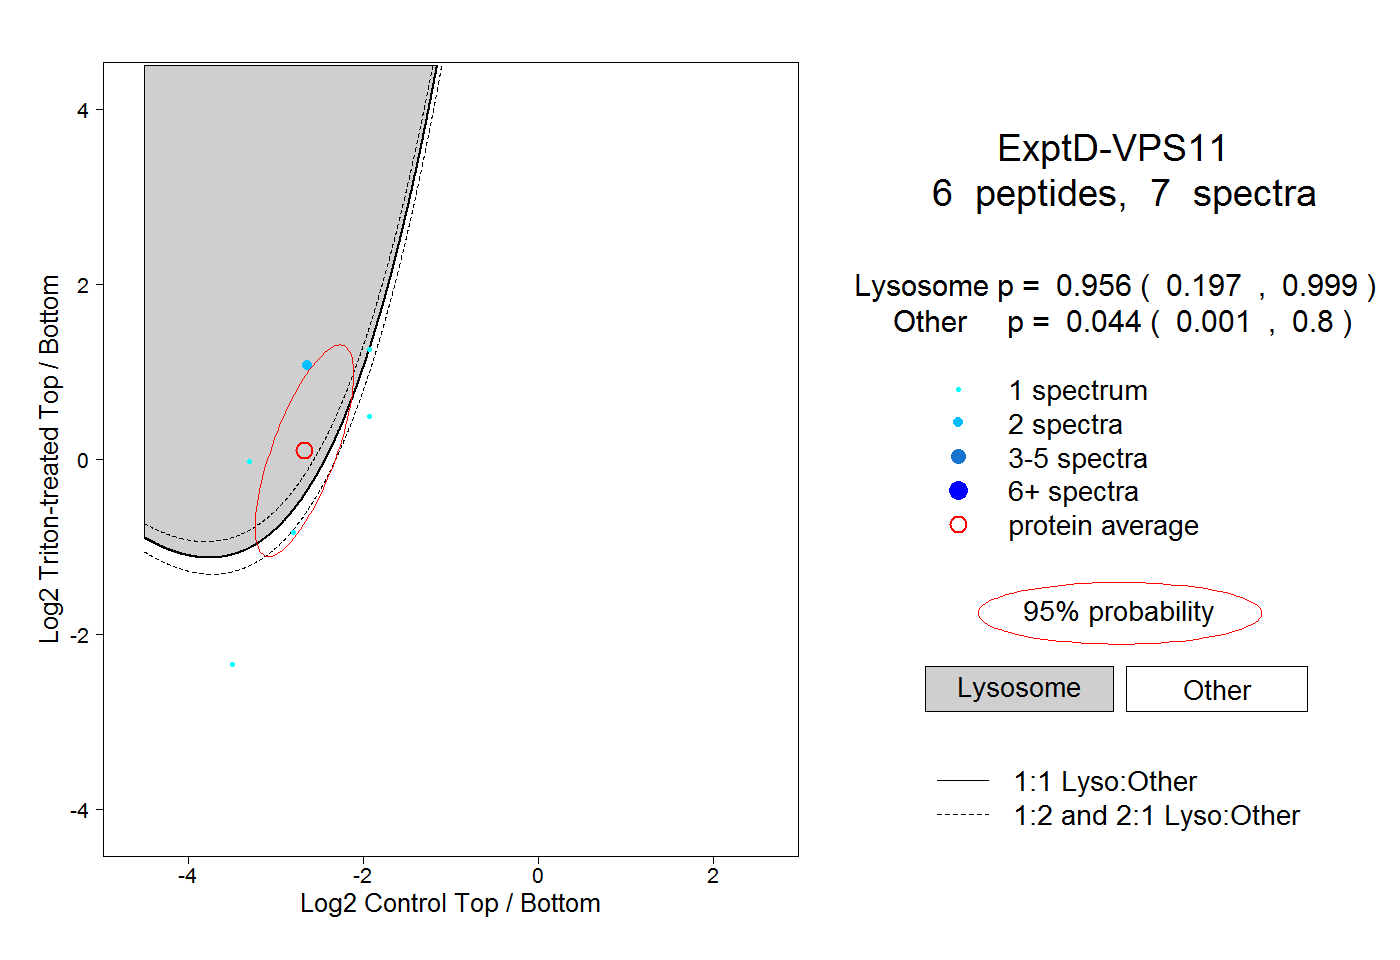 |
0.956 0.197 | 0.999 |
0.044 0.001 | 0.800 |