 6
6peptides
spectra
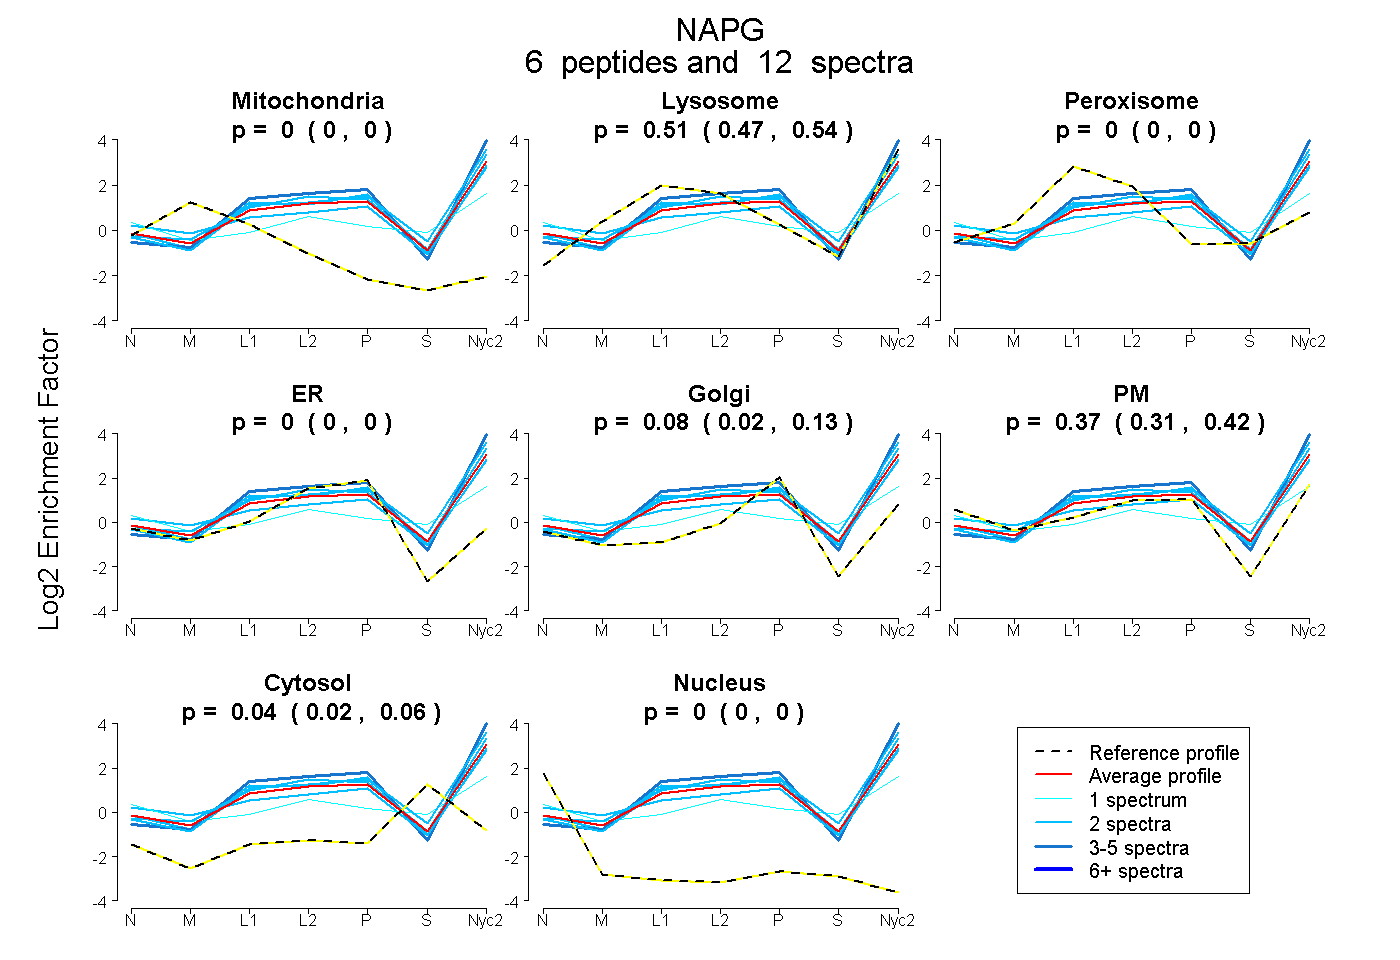
0.000 | 0.000
0.472 | 0.536
0.000 | 0.000
0.000 | 0.000
0.018 | 0.128
0.314 | 0.424
0.016 | 0.057
0.000 | 0.000
5peptides
spectra
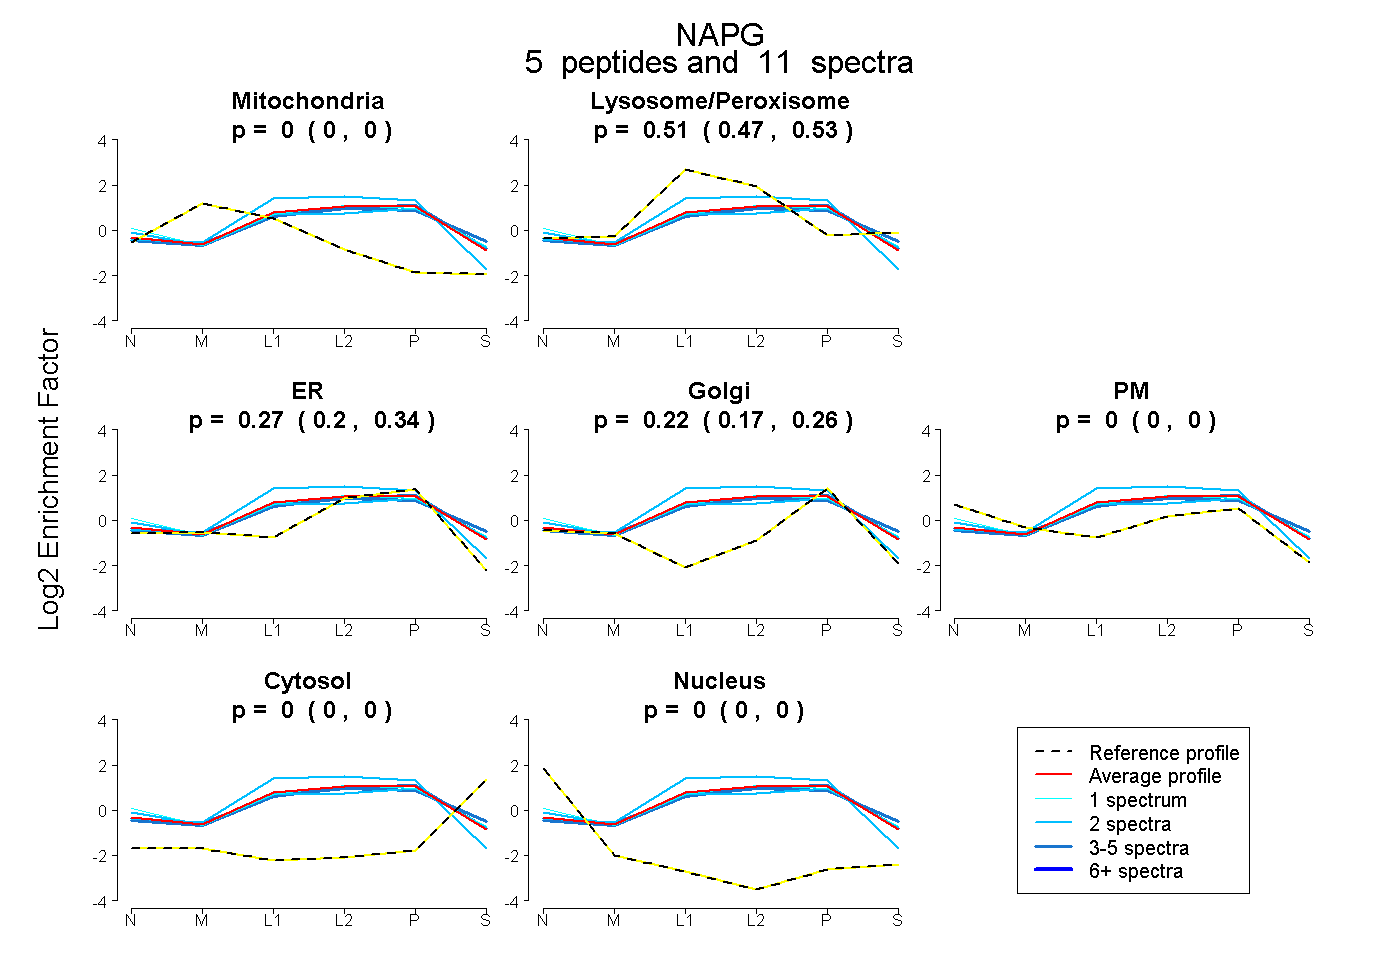
0.000 | 0.000
0.474 | 0.533
0.200 | 0.338
0.169 | 0.260
0.000 | 0.000
0.000 | 0.000
0.000 | 0.000
8peptides
spectra
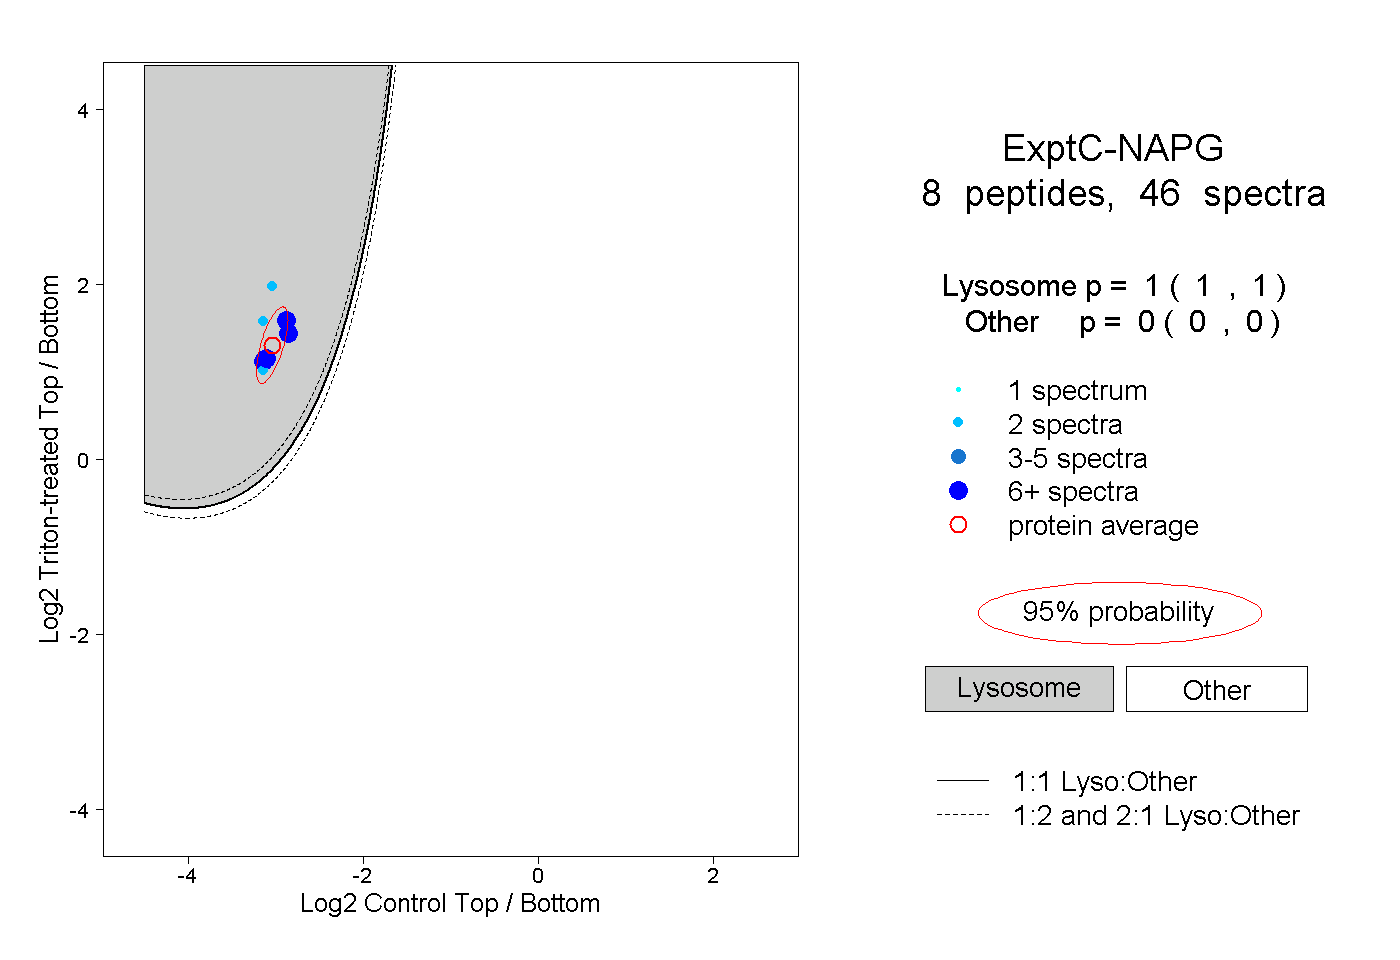
1.000 | 1.000
0.000 | 0.000
1peptide
spectrum
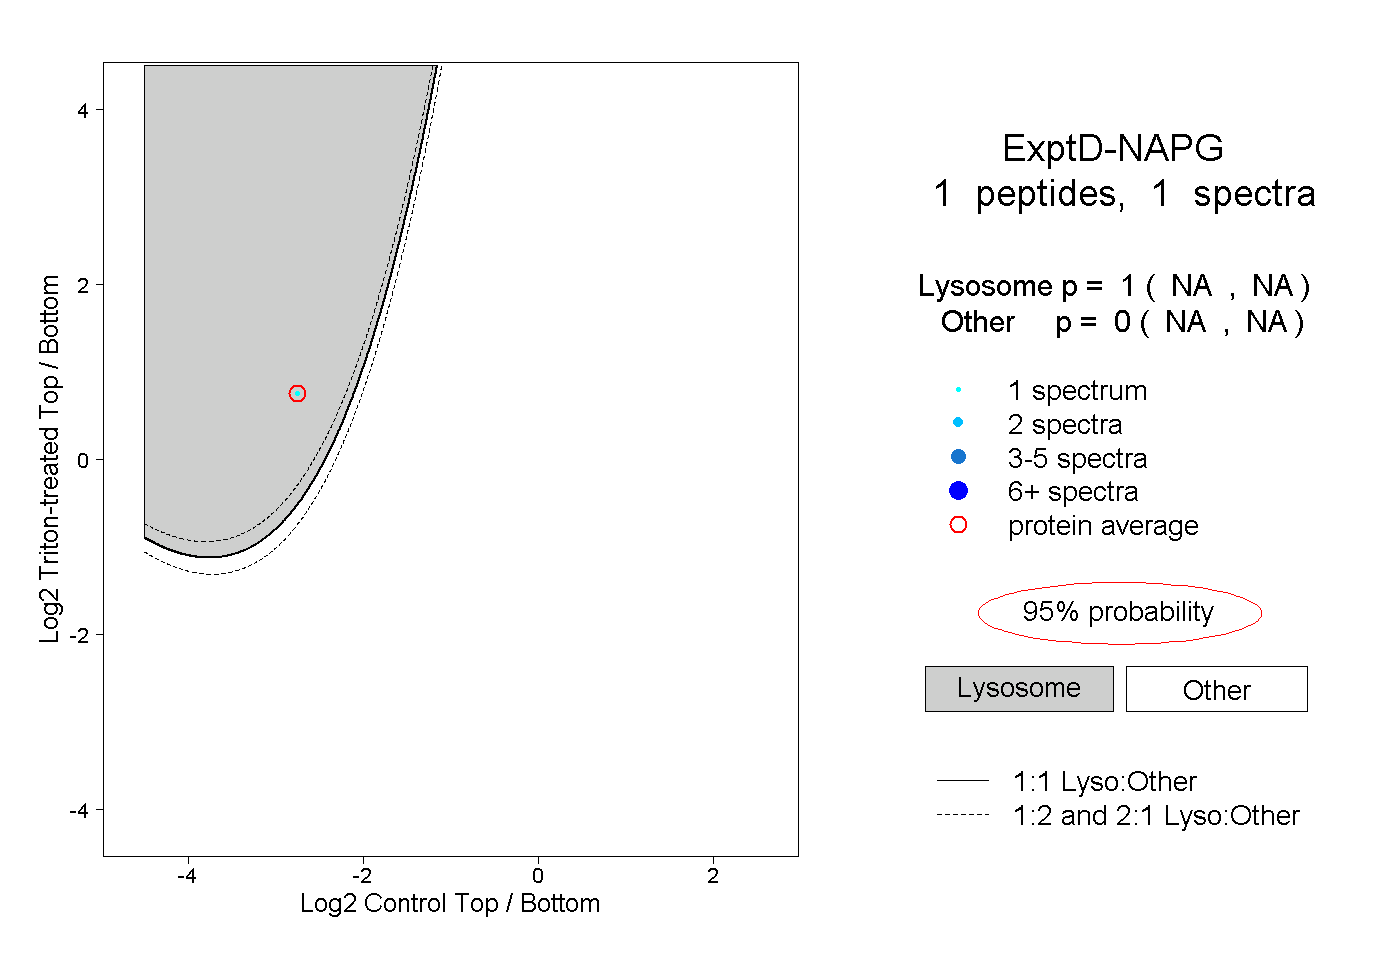
NA | NA
NA | NA