 6
6peptides
spectra
0.000 | 0.000
0.472 | 0.536
0.000 | 0.000
0.000 | 0.000
0.018 | 0.128
0.314 | 0.424
0.016 | 0.057
0.000 | 0.000
| Plot | Mito | Lyso | Perox | ER | Golgi | PM | Cytosol | Nucleus | |||||
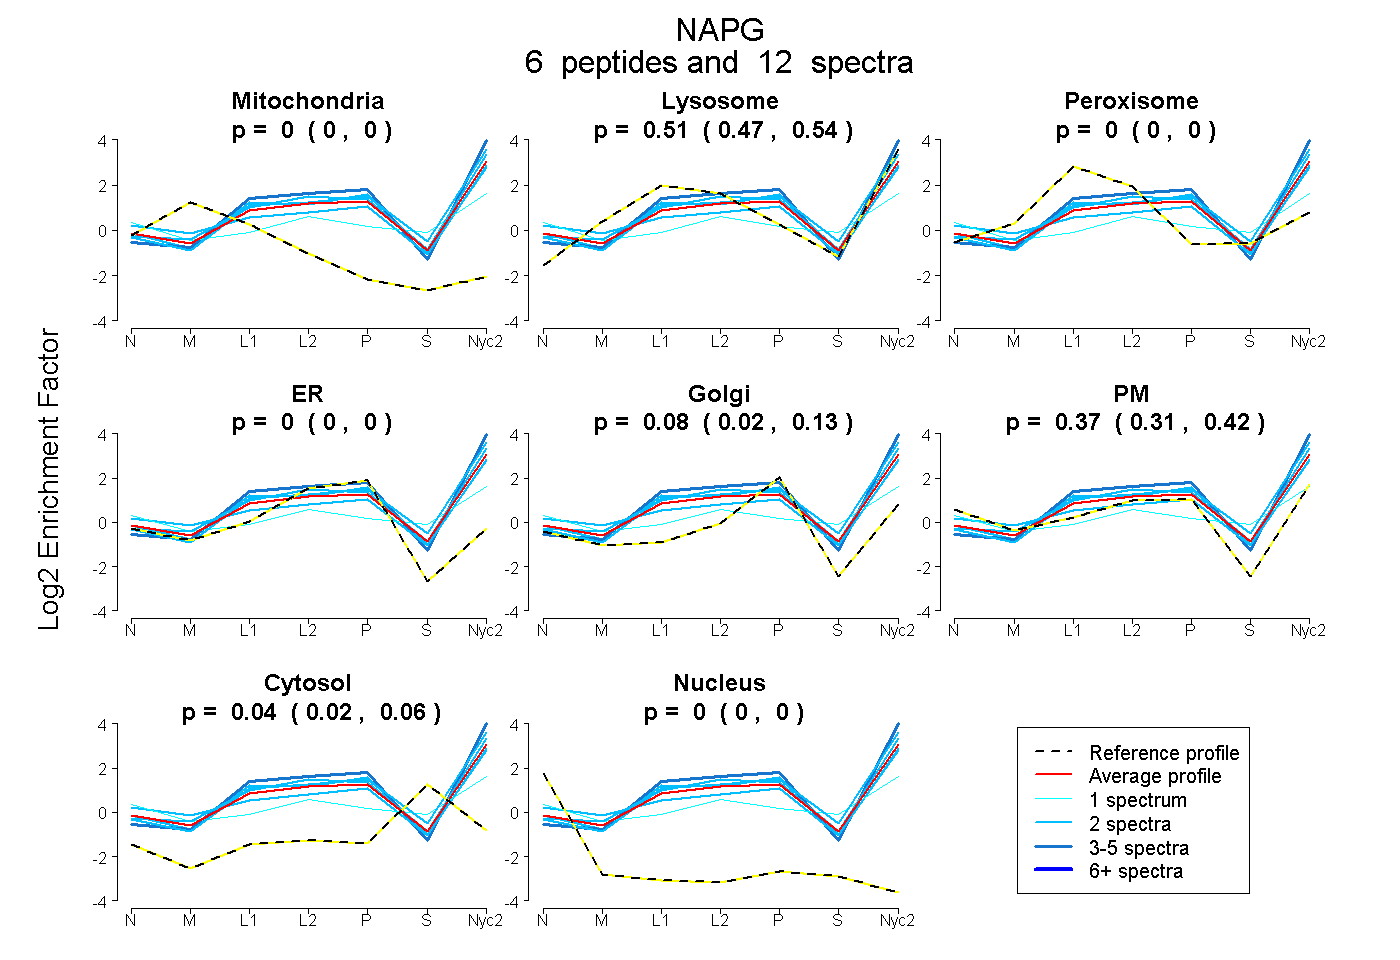
| Expt A |
6 peptides |
12 spectra |
|
0.000 0.000 | 0.000 |
0.509 0.472 | 0.536 |
0.000 0.000 | 0.000 |
0.000 0.000 | 0.000 |
0.079 0.018 | 0.128 |
0.375 0.314 | 0.424 |
0.038 0.016 | 0.057 |
0.000 0.000 | 0.000 |
| 3 spectra, LGLSLVVPGGGIK | 0.000 | 0.698 | 0.000 | 0.000 | 0.093 | 0.208 | 0.000 | 0.000 | ||
| 2 spectra, EIENYPTCYK | 0.000 | 0.501 | 0.000 | 0.000 | 0.166 | 0.327 | 0.006 | 0.000 | ||
| 2 spectra, TIAQVLVHLHR | 0.000 | 0.603 | 0.000 | 0.000 | 0.070 | 0.327 | 0.000 | 0.000 | ||
| 2 spectra, NDYVAAER | 0.000 | 0.378 | 0.000 | 0.000 | 0.000 | 0.571 | 0.052 | 0.000 | ||
| 2 spectra, YMDNDYAK | 0.000 | 0.664 | 0.000 | 0.000 | 0.170 | 0.147 | 0.019 | 0.000 | ||
| 1 spectrum, QAVELLGK | 0.000 | 0.191 | 0.048 | 0.000 | 0.000 | 0.462 | 0.300 | 0.000 |
| Plot | Mito | Lyso or Perox | ER | Golgi | PM | Cytosol | Nucleus | ||||||
| Expt B |
5 peptides |
11 spectra |
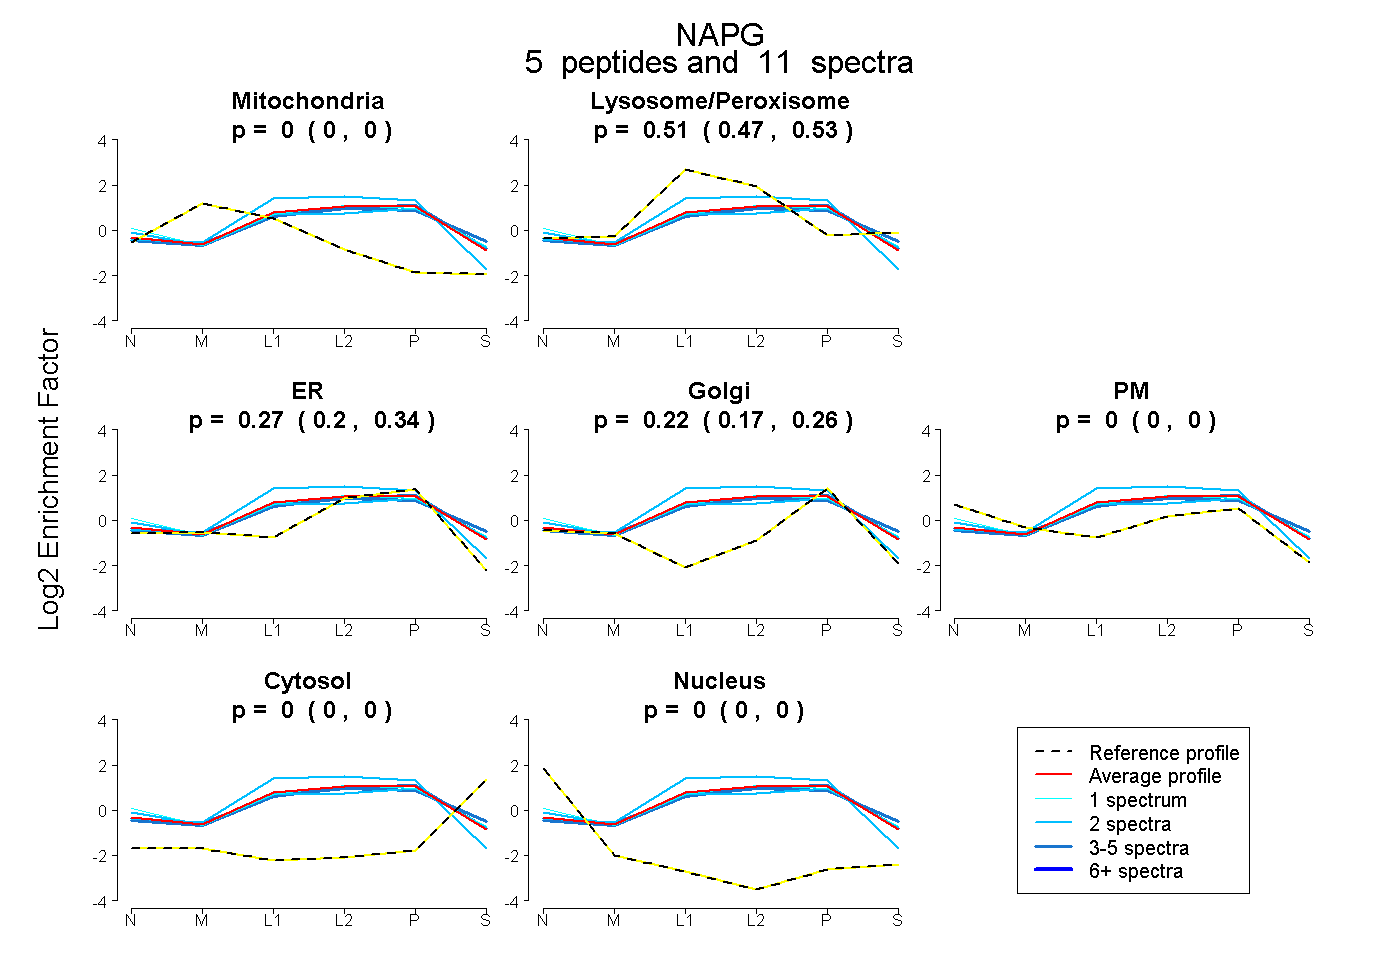 |
0.000 0.000 | 0.000 |
0.507 0.474 | 0.533 |
0.273 0.200 | 0.338 |
0.220 0.169 | 0.260 |
0.000 0.000 | 0.000 |
0.000 0.000 | 0.000 |
0.000 0.000 | 0.000 |
|||
| Plot | Lyso | Other | |||||||||||
| Expt C |
8 peptides |
46 spectra |
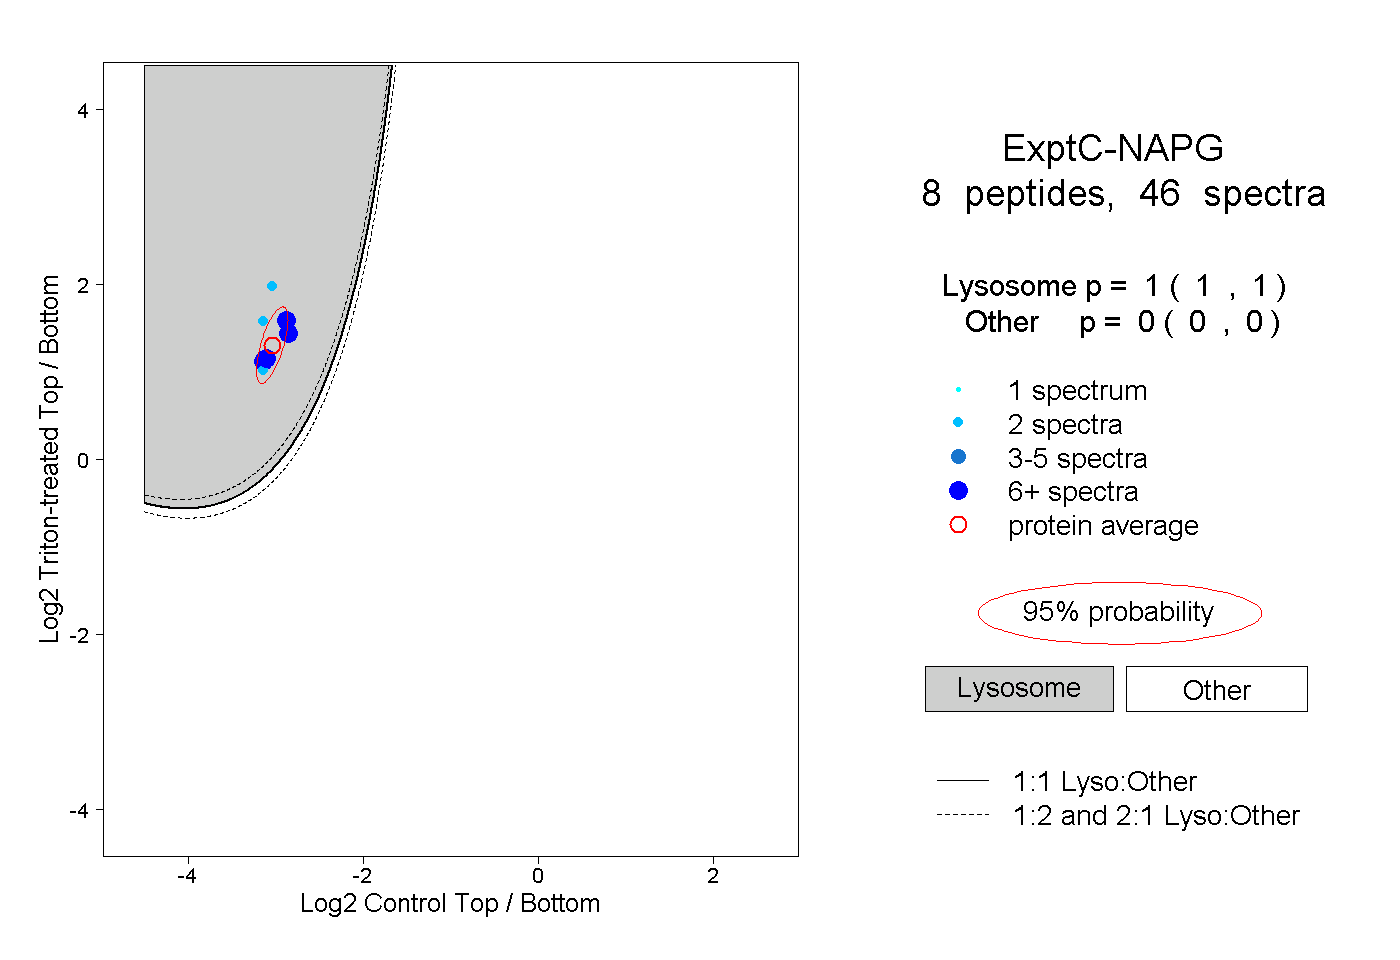 |
1.000 1.000 | 1.000 |
0.000 0.000 | 0.000 |
||||||||
| Plot | Lyso | Other | |||||||||||
| Expt D |
1 peptide |
1 spectrum |
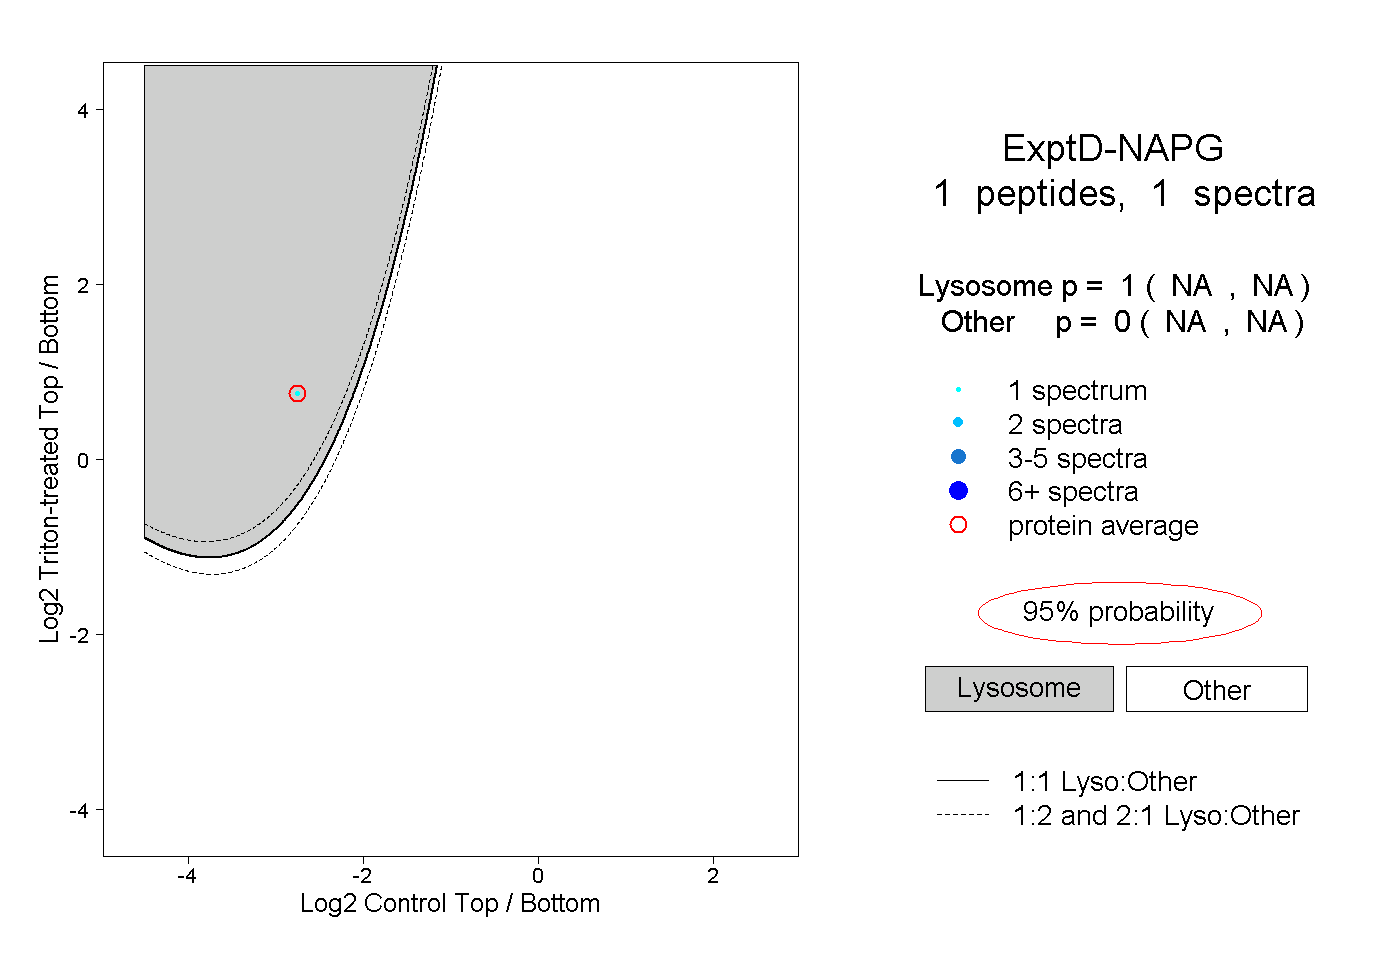 |
1.000 NA | NA |
0.000 NA | NA |