NAPG
[ENSRNOP00000061787]
Main page
| | | Plot |
Mito |
Lyso |
|
Perox |
ER |
Golgi |
PM |
Cytosol |
Nucleus |
|
| Expt A |
 6
6
peptides |
12
spectra |
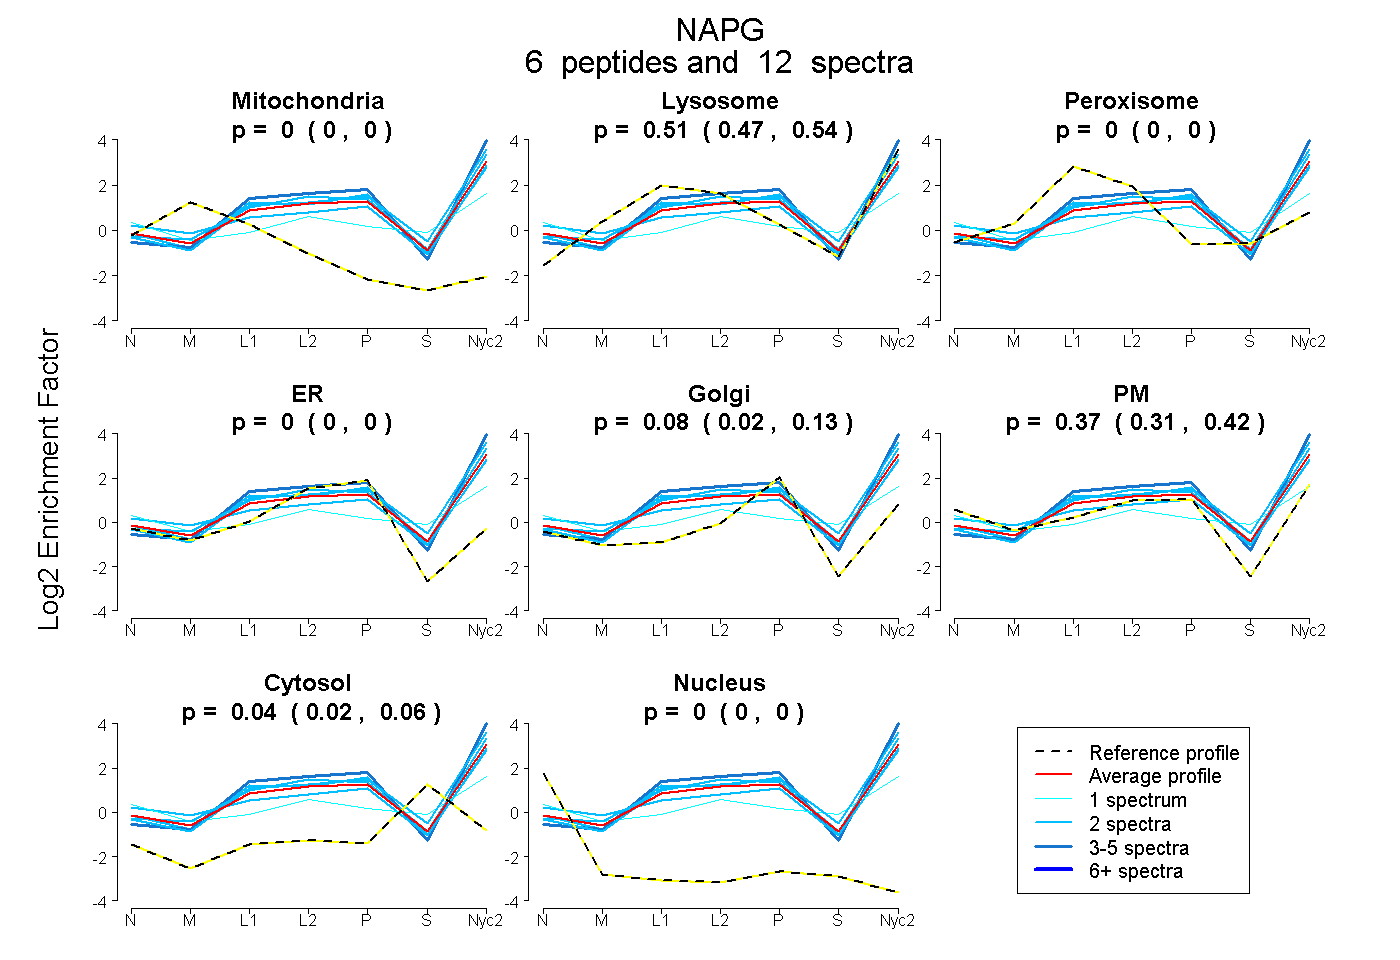 |
0.000
0.000 | 0.000 |
0.509
0.472 | 0.536 |
|
0.000
0.000 | 0.000 |
0.000
0.000 | 0.000 |
0.079
0.018 | 0.128 |
0.375
0.314 | 0.424 |
0.038
0.016 | 0.057 |
0.000
0.000 | 0.000 |
|
| | | Plot |
Mito |
|
Lyso or Perox |
|
ER |
Golgi |
PM |
Cytosol |
Nucleus |
|
| Expt B |
5
peptides |
11
spectra |
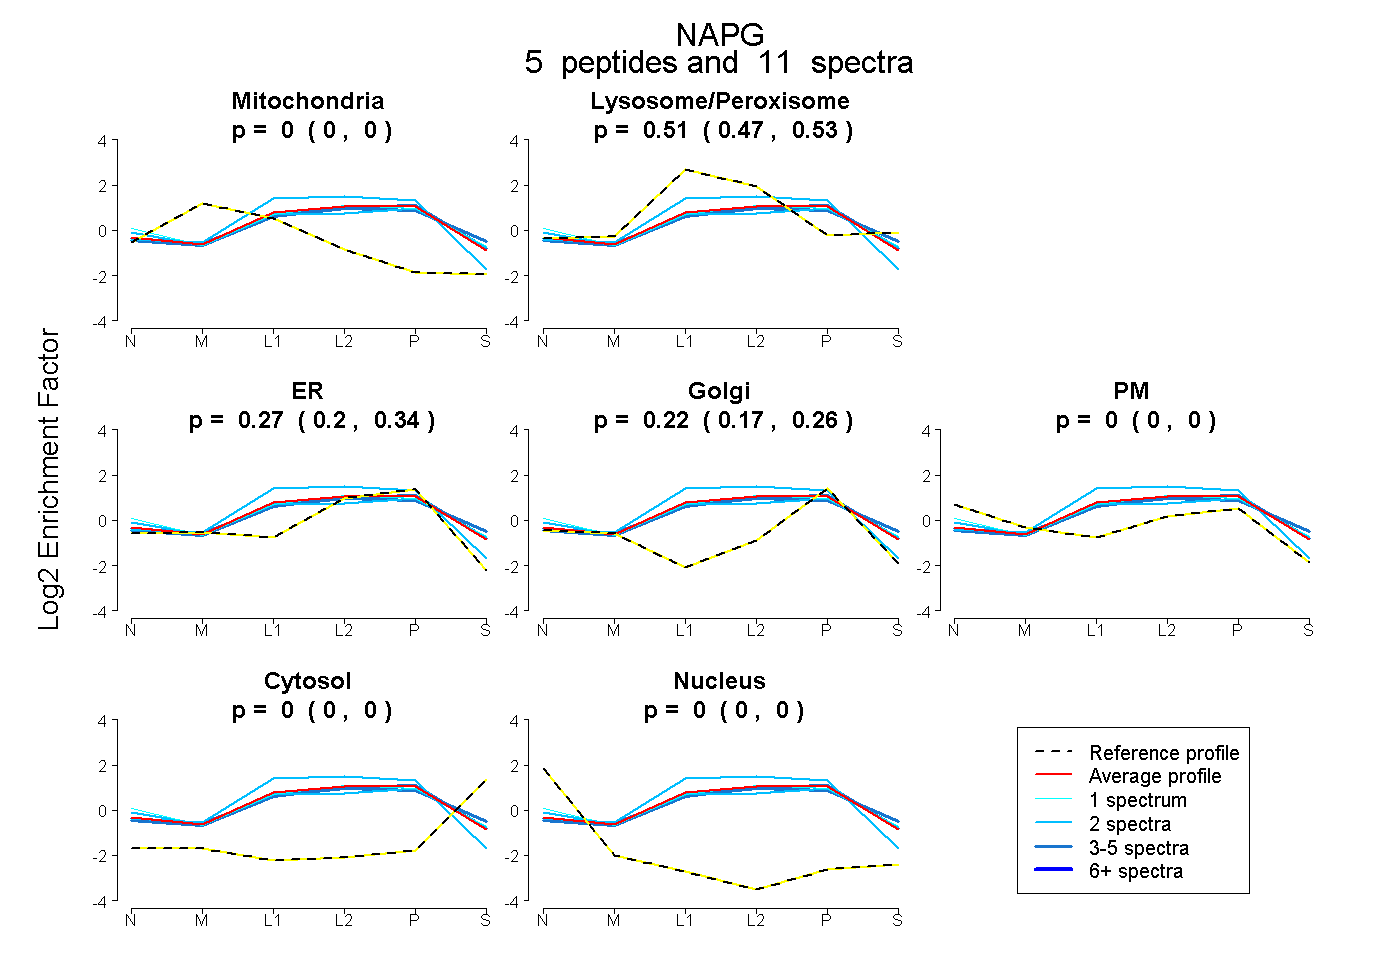 |
0.000
0.000 | 0.000 |
|
0.507
0.474 | 0.533 |
|
0.273
0.200 | 0.338 |
0.220
0.169 | 0.260 |
0.000
0.000 | 0.000 |
0.000
0.000 | 0.000 |
0.000
0.000 | 0.000 |
|
| 3 spectra, LGLSLVVPGGGIK |
0.000 |
|
0.575 |
|
0.036 |
0.388 |
0.000 |
0.000 |
0.000 |
|
| 2 spectra, LPEAVQLIEK |
0.000 |
|
0.554 |
|
0.025 |
0.407 |
0.015 |
0.000 |
0.000 |
|
| 2 spectra, TIAQVLVHLHR |
0.000 |
|
0.458 |
|
0.542 |
0.000 |
0.000 |
0.000 |
0.000 |
|
| 3 spectra, LIENVDPEK |
0.000 |
|
0.476 |
|
0.274 |
0.250 |
0.000 |
0.000 |
0.000 |
|
| 1 spectrum, NDYVAAER |
0.000 |
|
0.495 |
|
0.174 |
0.189 |
0.142 |
0.000 |
0.000 |
|
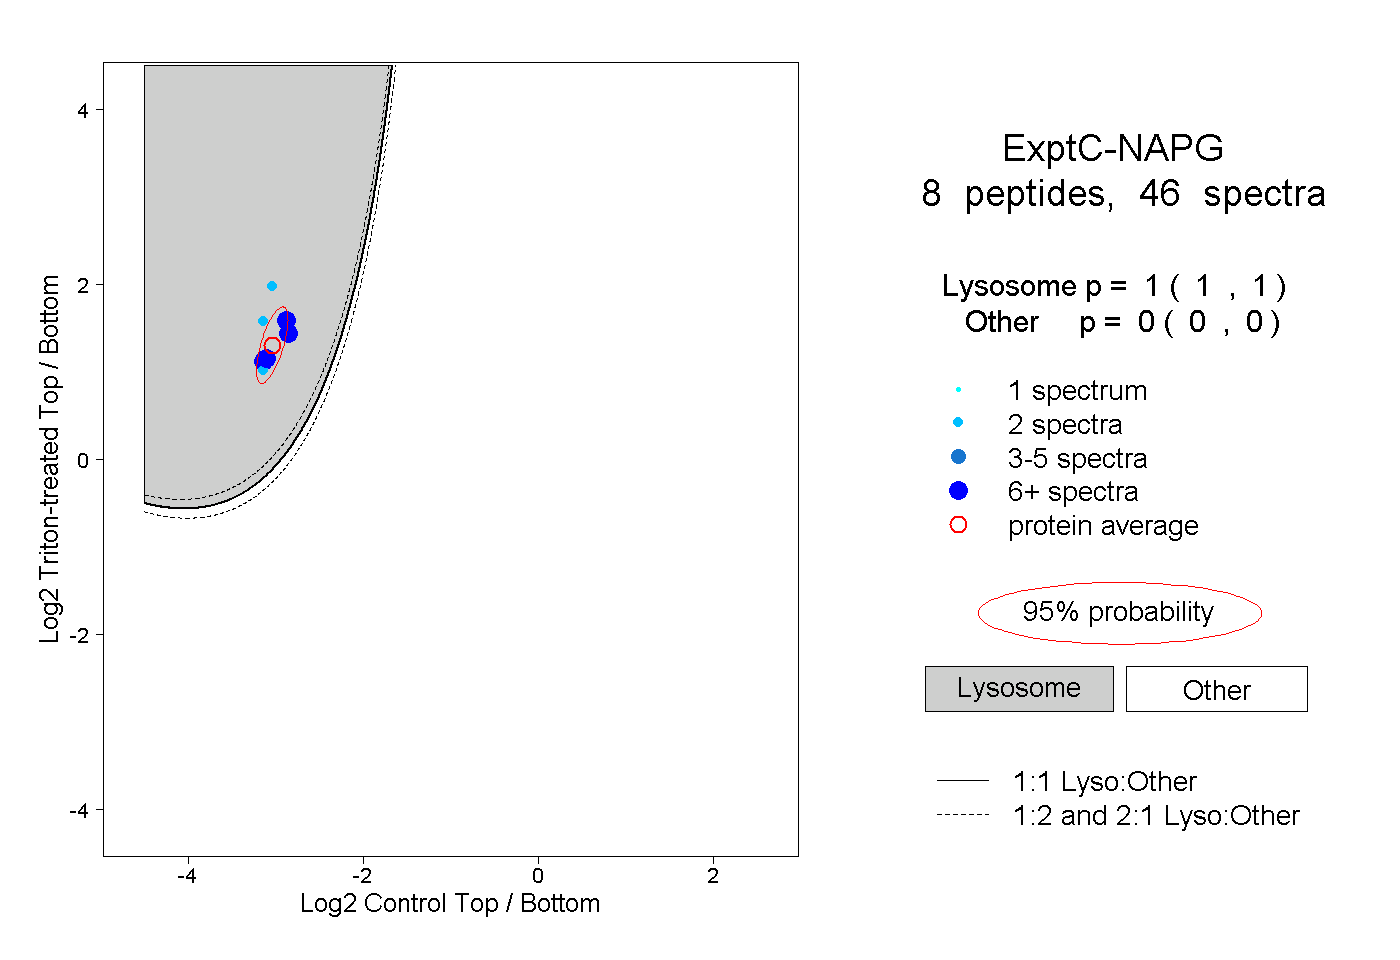
| | | Plot |
|
Lyso |
|
|
|
|
|
|
|
Other |
| Expt C |
8
peptides |
46
spectra |
 |
|
1.000
1.000 | 1.000 |
|
|
|
|
|
|
|
0.000
0.000 | 0.000 |
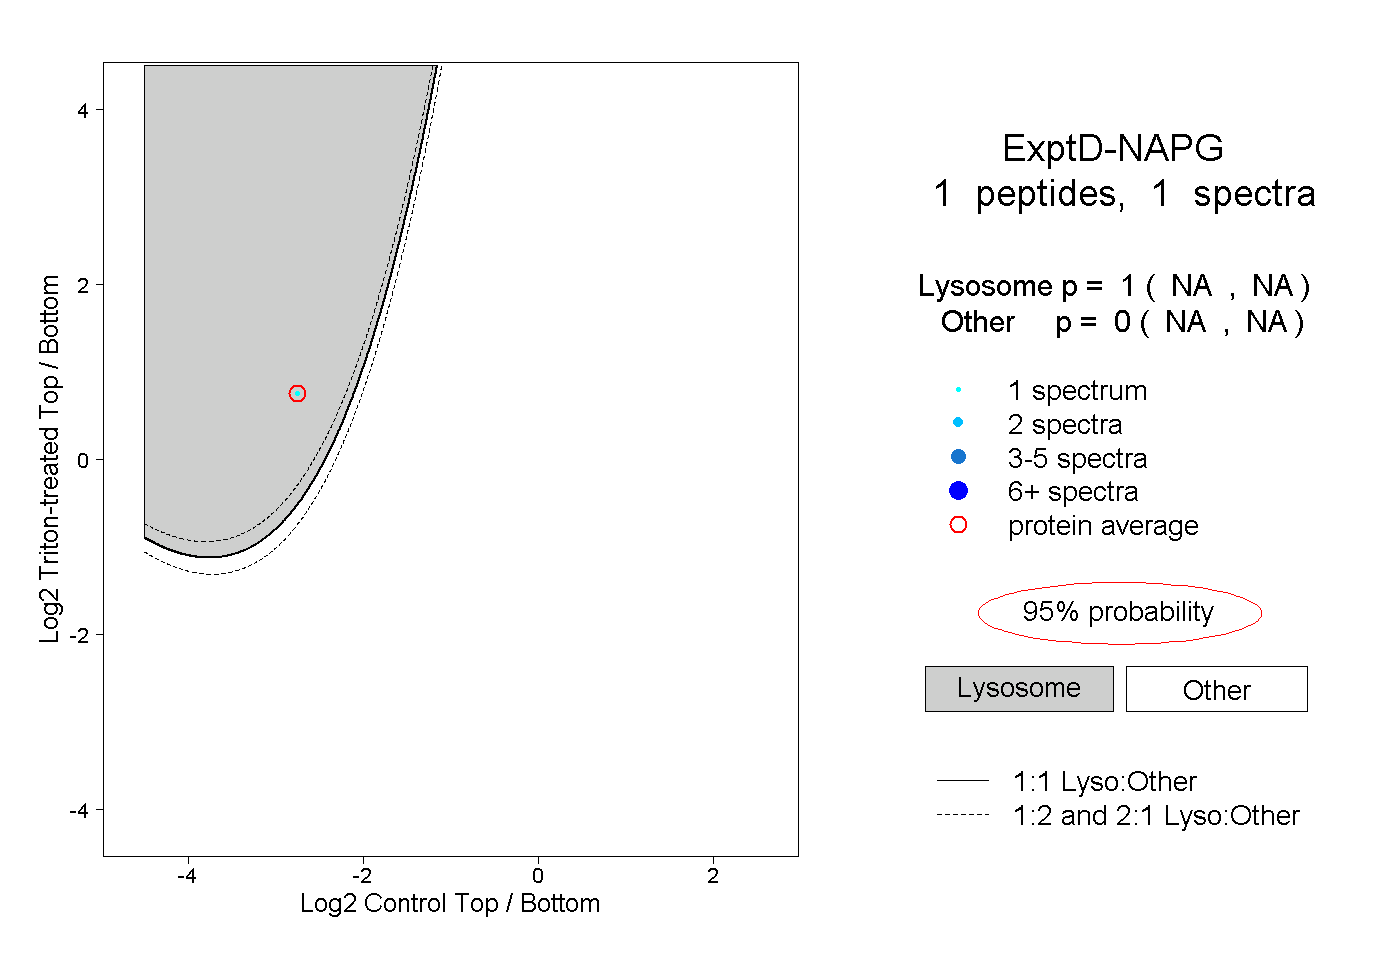
| | | Plot |
|
Lyso |
|
|
|
|
|
|
|
Other |
| Expt D |
1
peptide |
1
spectrum |
 |
|
1.000
NA | NA |
|
|
|
|
|
|
|
0.000
NA | NA |