 15
15peptides
spectra
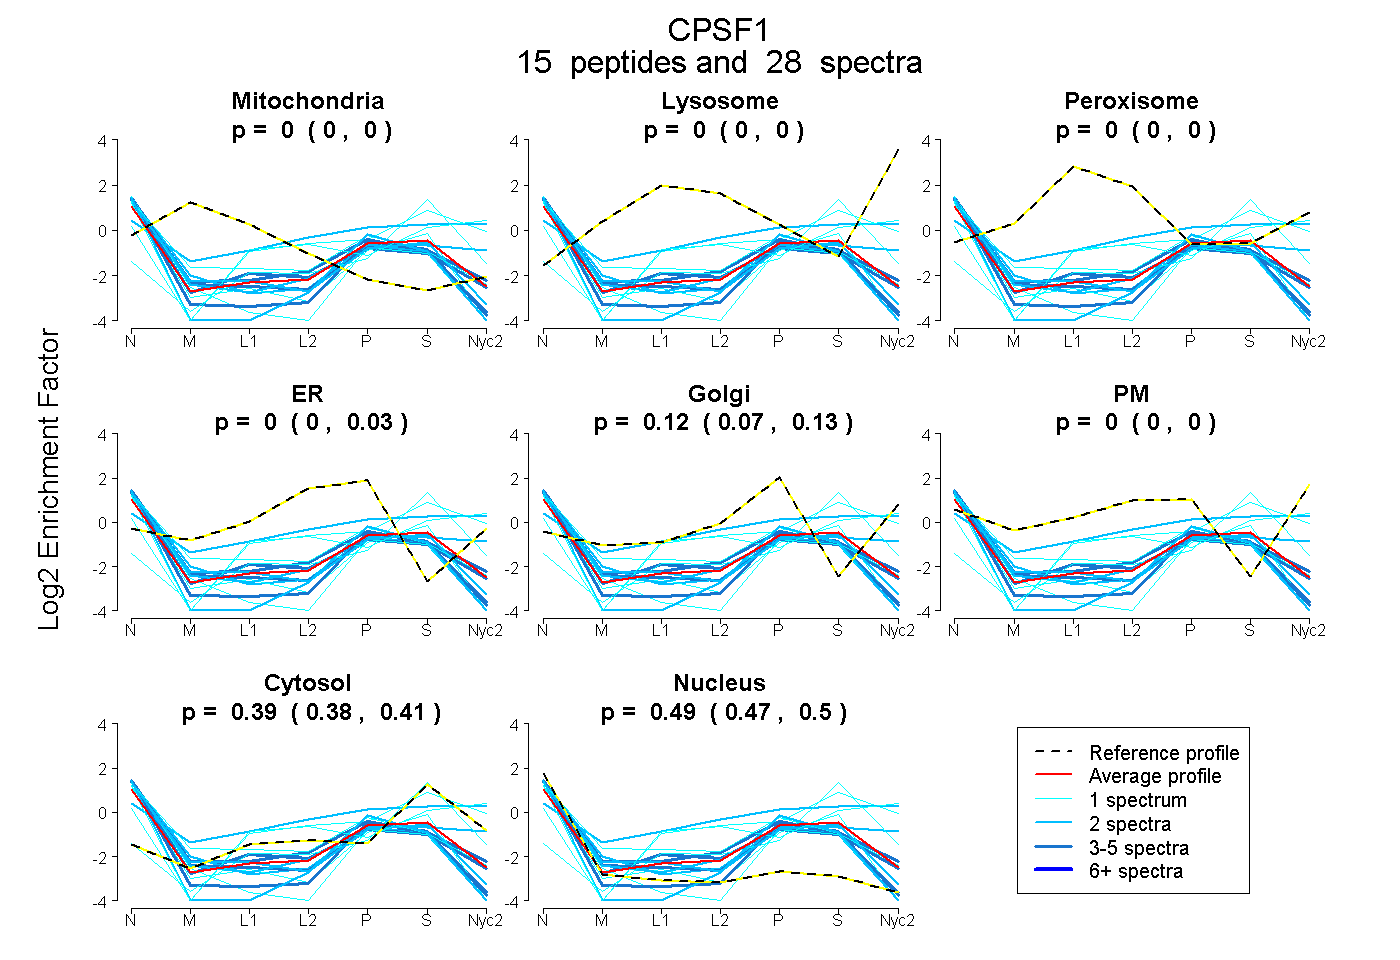
0.000 | 0.000
0.000 | 0.000
0.000 | 0.000
0.000 | 0.031
0.070 | 0.132
0.000 | 0.000
0.377 | 0.405
0.472 | 0.500
3peptides
spectra
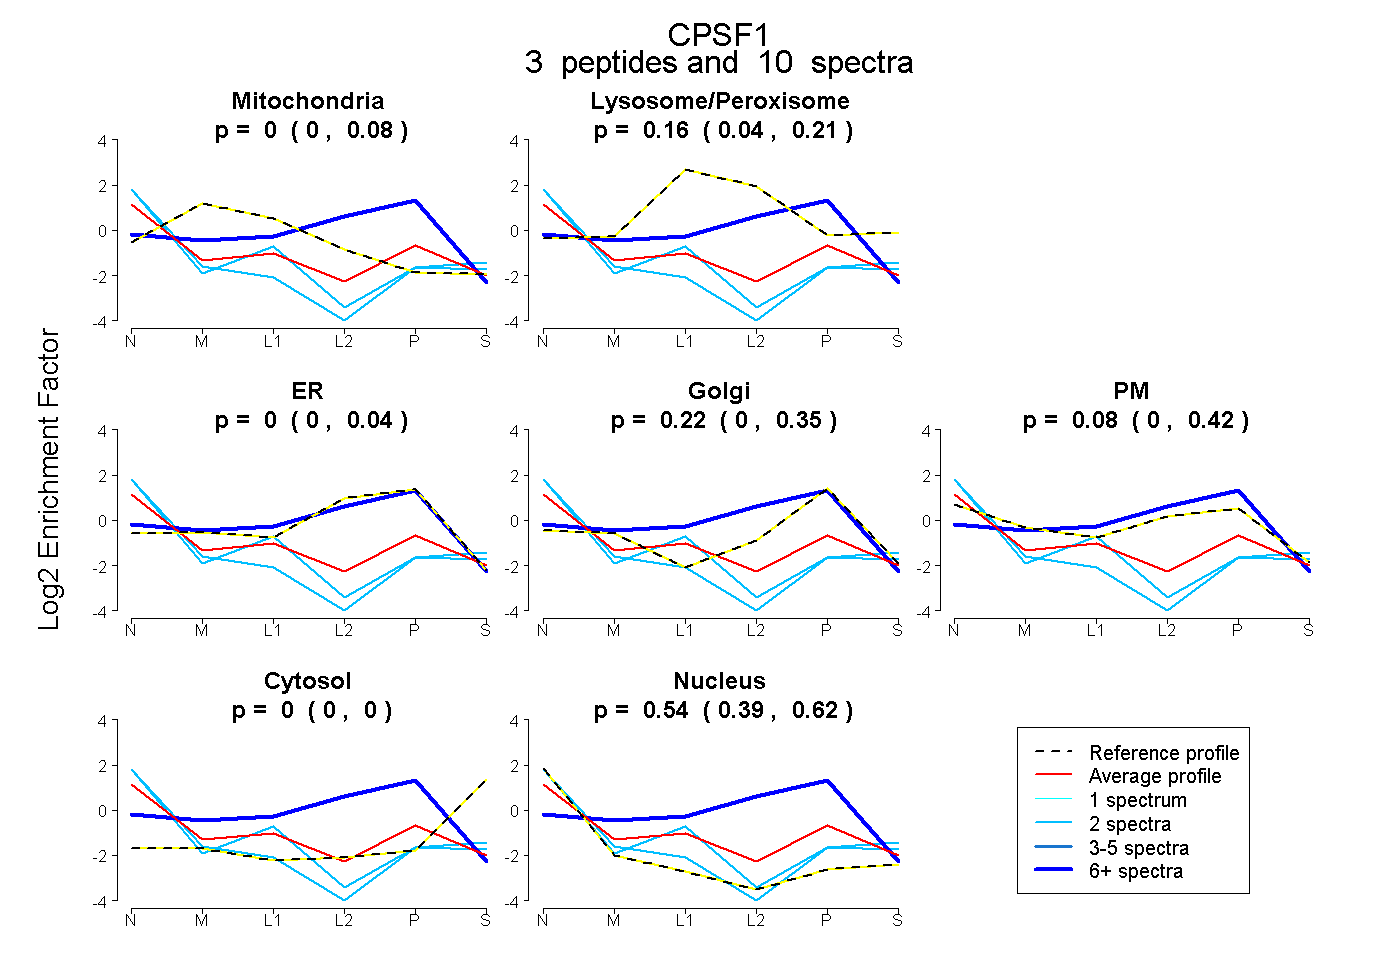
0.000 | 0.079
0.039 | 0.210
0.000 | 0.044
0.000 | 0.351
0.000 | 0.422
0.000 | 0.000
0.388 | 0.625