CPSF1
[ENSRNOP00000061764]
Main page
| | | Plot |
Mito |
Lyso |
|
Perox |
ER |
Golgi |
PM |
Cytosol |
Nucleus |
|
| Expt A |
 15
15
peptides |
28
spectra |
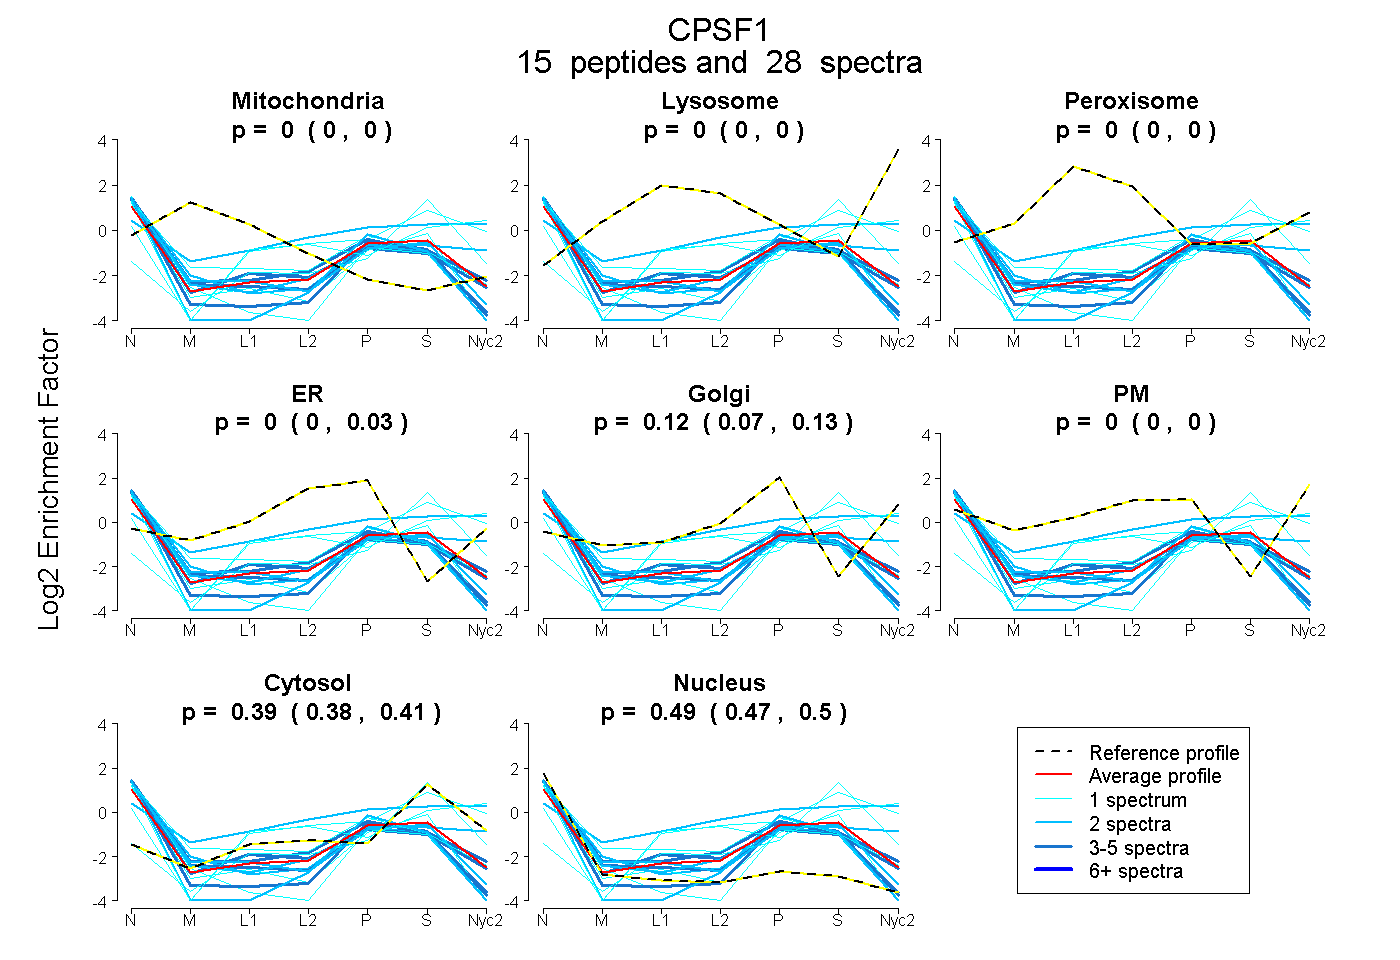 |
0.000
0.000 | 0.000 |
0.000
0.000 | 0.000 |
|
0.000
0.000 | 0.000 |
0.000
0.000 | 0.031 |
0.120
0.070 | 0.132 |
0.000
0.000 | 0.000 |
0.392
0.377 | 0.405 |
0.487
0.472 | 0.500 |
|
| | | Plot |
Mito |
|
Lyso or Perox |
|
ER |
Golgi |
PM |
Cytosol |
Nucleus |
|
| Expt B |
3
peptides |
10
spectra |
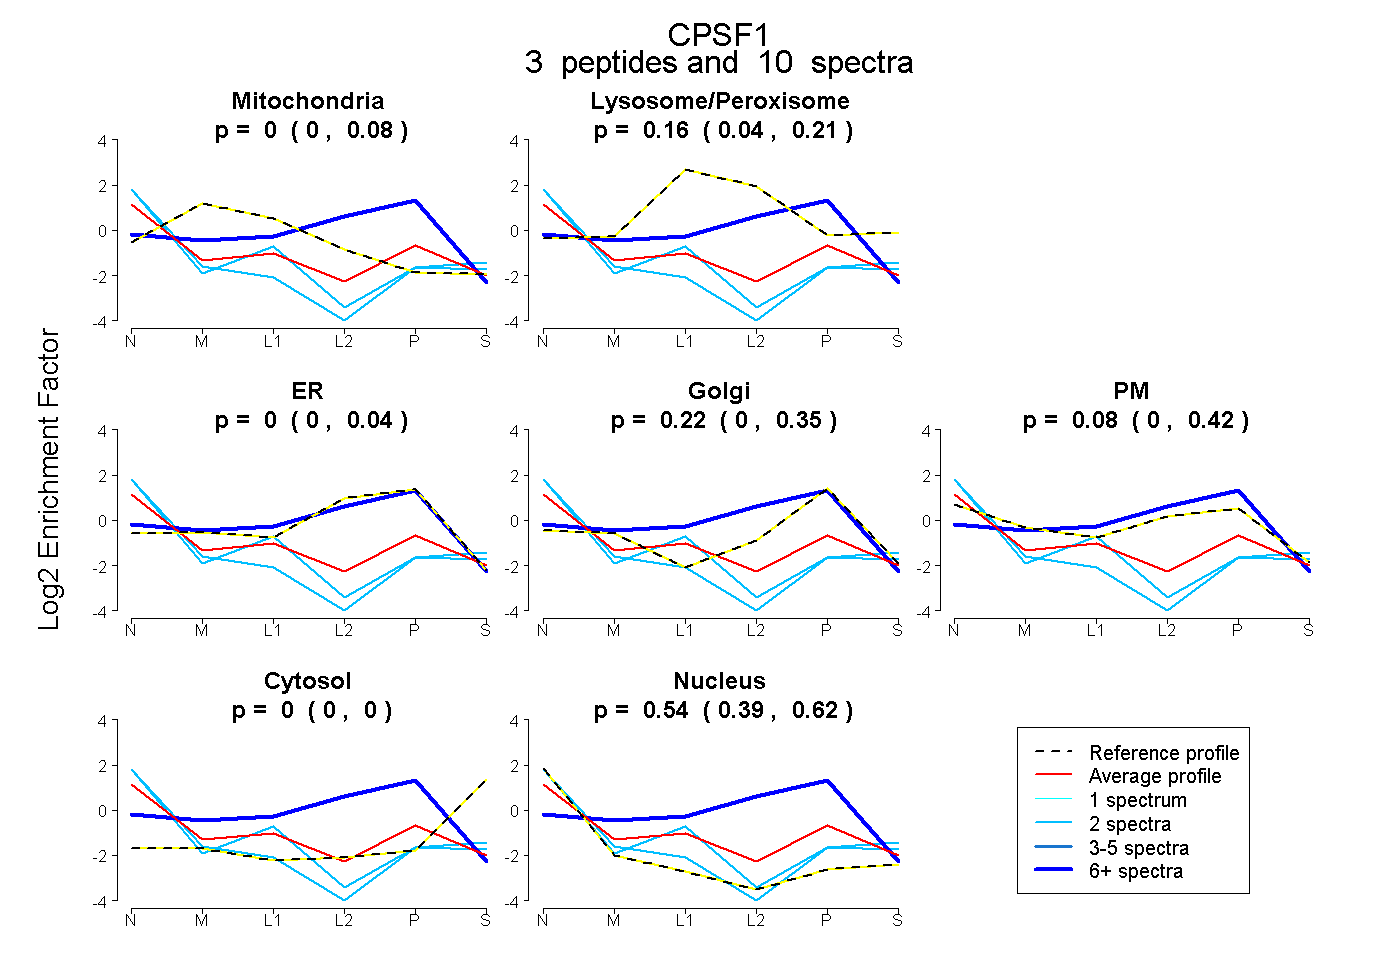 |
0.000
0.000 | 0.079 |
|
0.163
0.039 | 0.210 |
|
0.000
0.000 | 0.044 |
0.215
0.000 | 0.351 |
0.084
0.000 | 0.422 |
0.000
0.000 | 0.000 |
0.538
0.388 | 0.625 |
|
| 2 spectra, HGFLILSR |
0.000 |
|
0.206 |
|
0.000 |
0.000 |
0.000 |
0.000 |
0.794 |
|
| 2 spectra, EVLLVALGSR |
0.000 |
|
0.007 |
|
0.000 |
0.094 |
0.000 |
0.039 |
0.859 |
|
| 6 spectra, NVLDGELLNR |
0.001 |
|
0.049 |
|
0.709 |
0.000 |
0.241 |
0.000 |
0.000 |
|