 12
12peptides
spectra
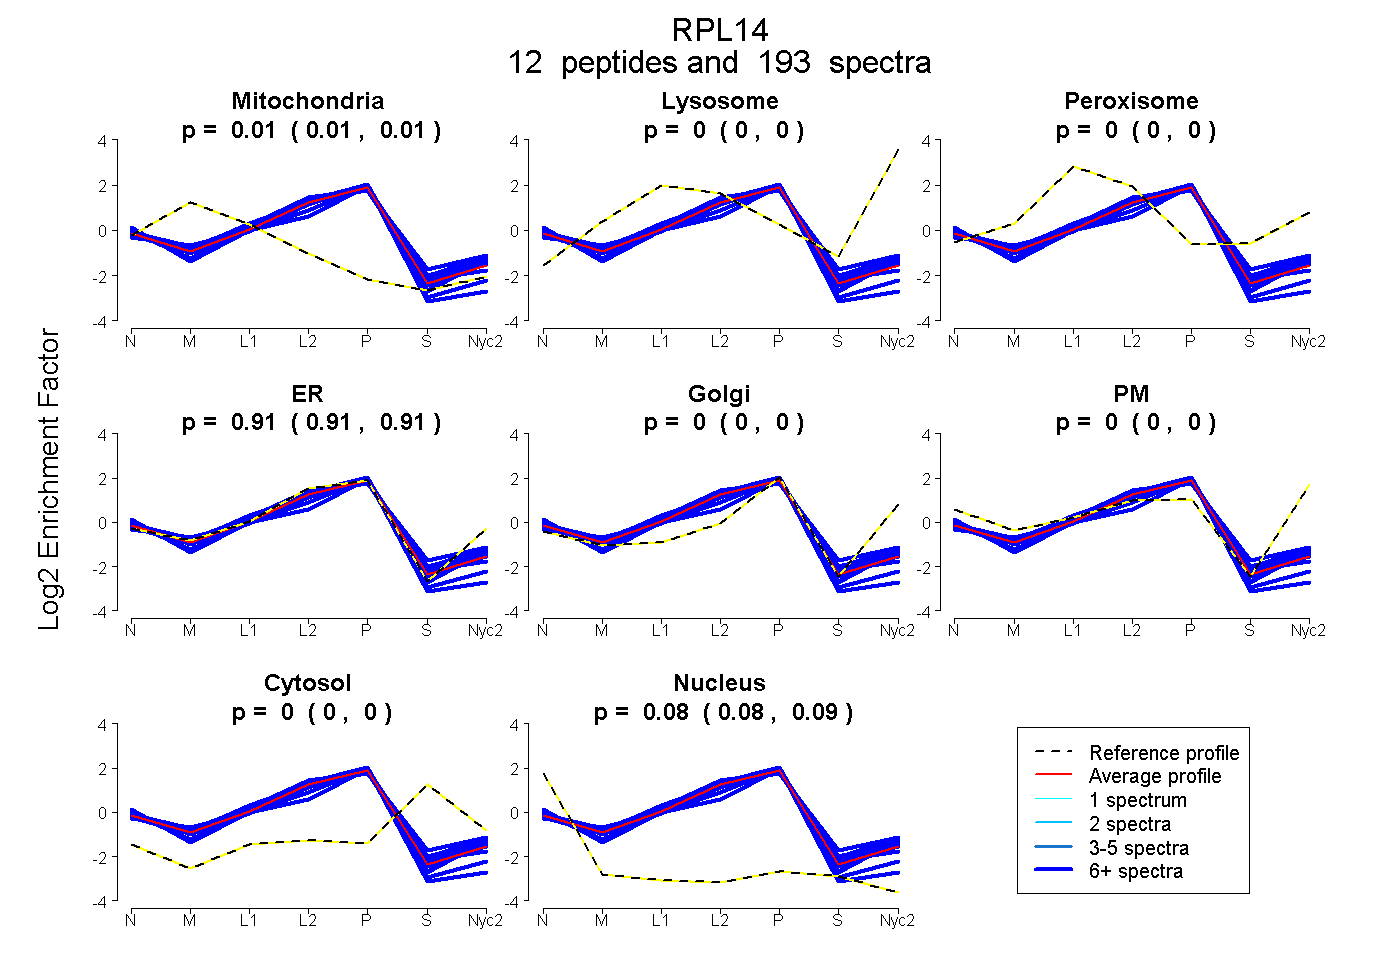
0.005 | 0.008
0.000 | 0.000
0.000 | 0.000
0.907 | 0.910
0.000 | 0.000
0.000 | 0.000
0.000 | 0.000
0.083 | 0.086
9peptides
spectra
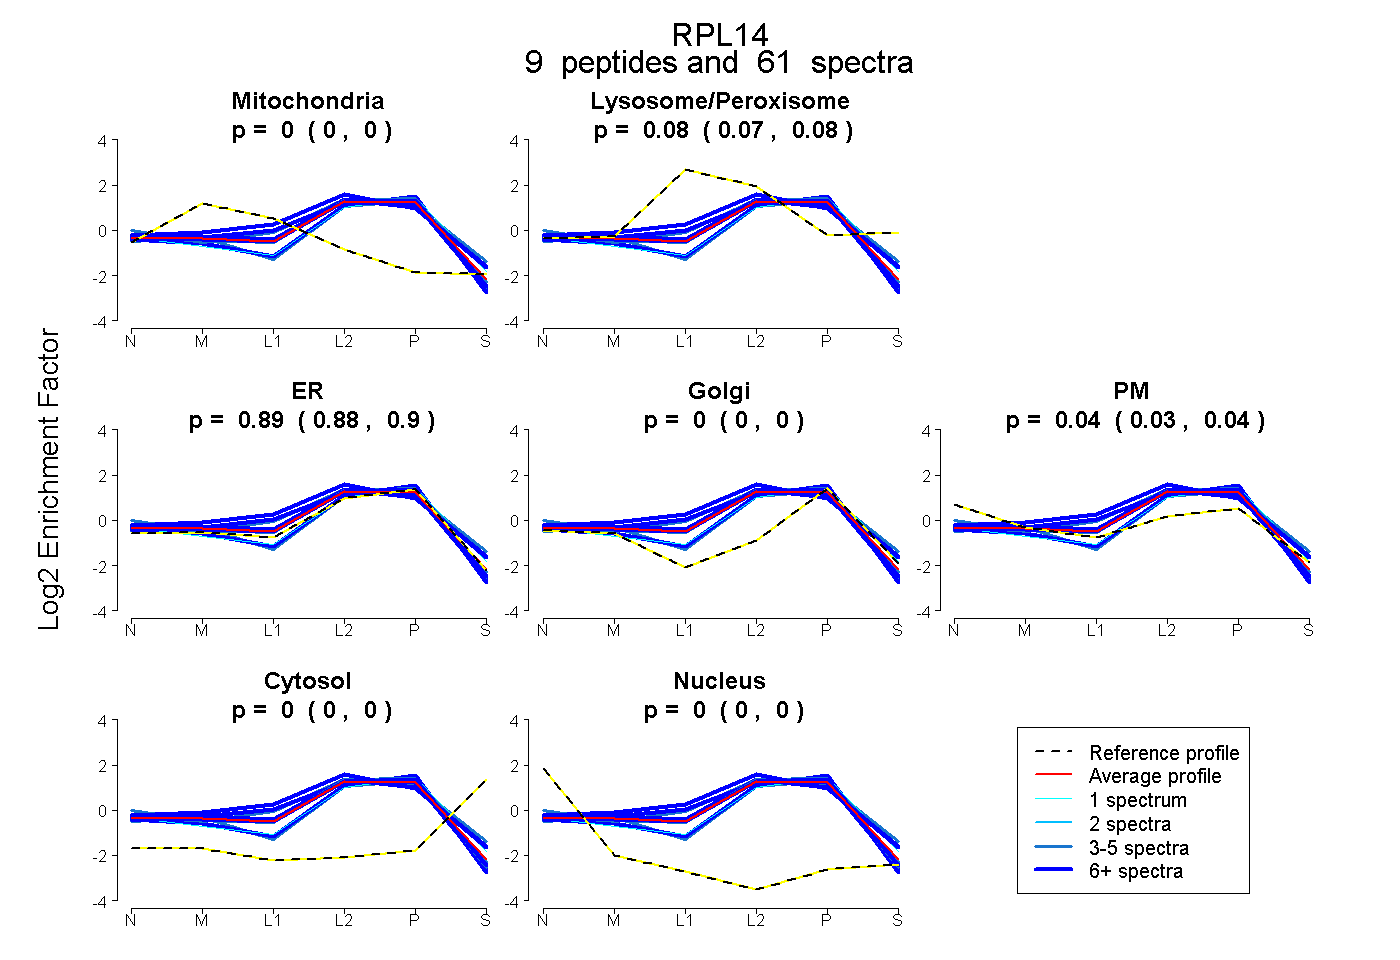
0.000 | 0.000
0.066 | 0.083
0.878 | 0.898
0.000 | 0.000
0.026 | 0.043
0.000 | 0.000
0.000 | 0.000
11peptides
spectra
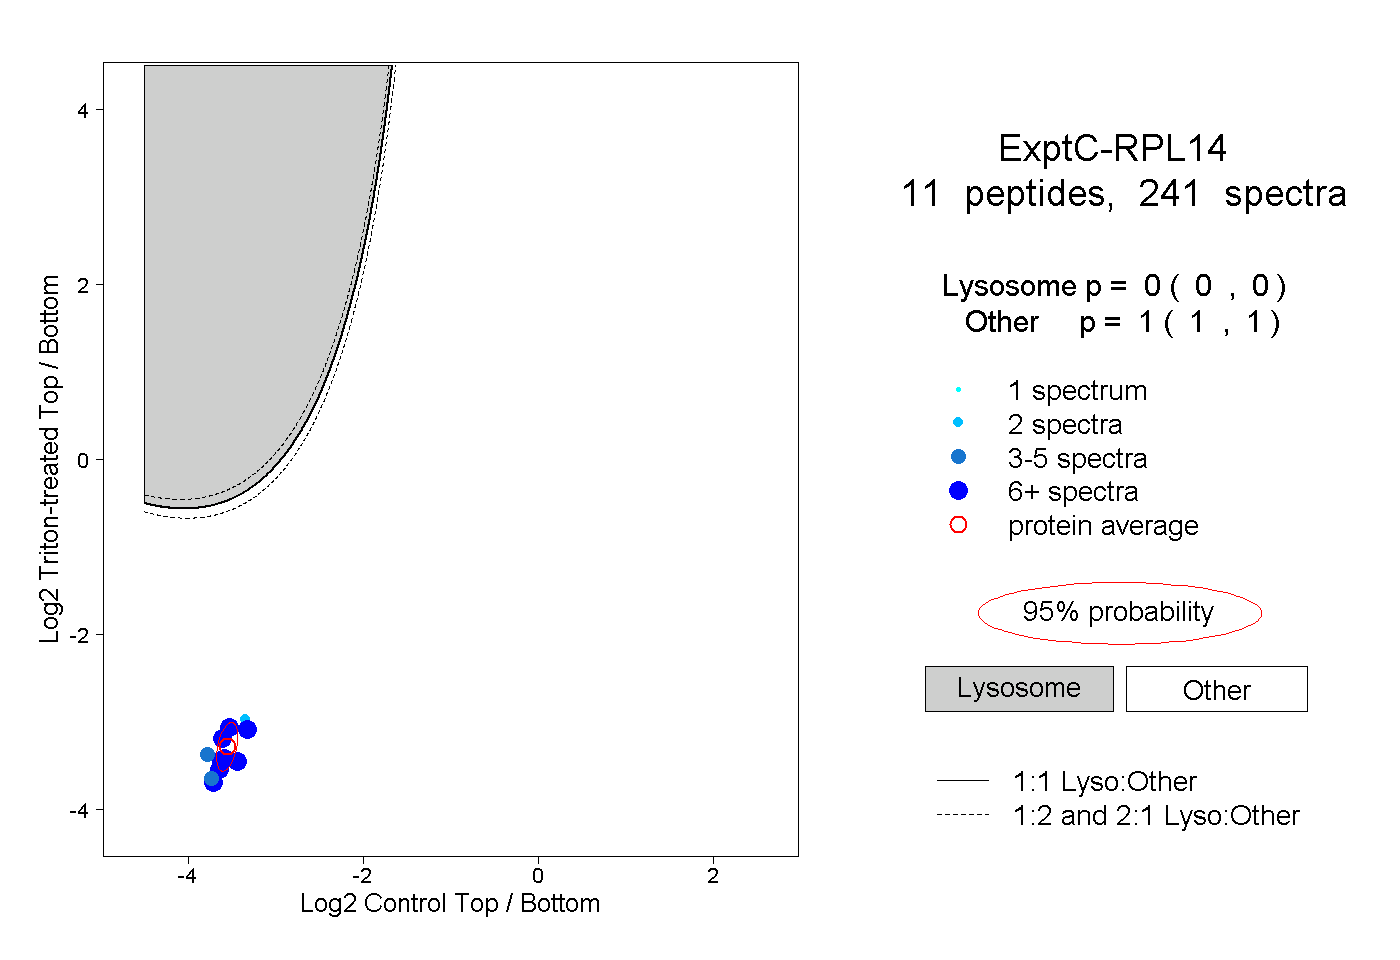
0.000 | 0.000
1.000 | 1.000
7peptides
spectra
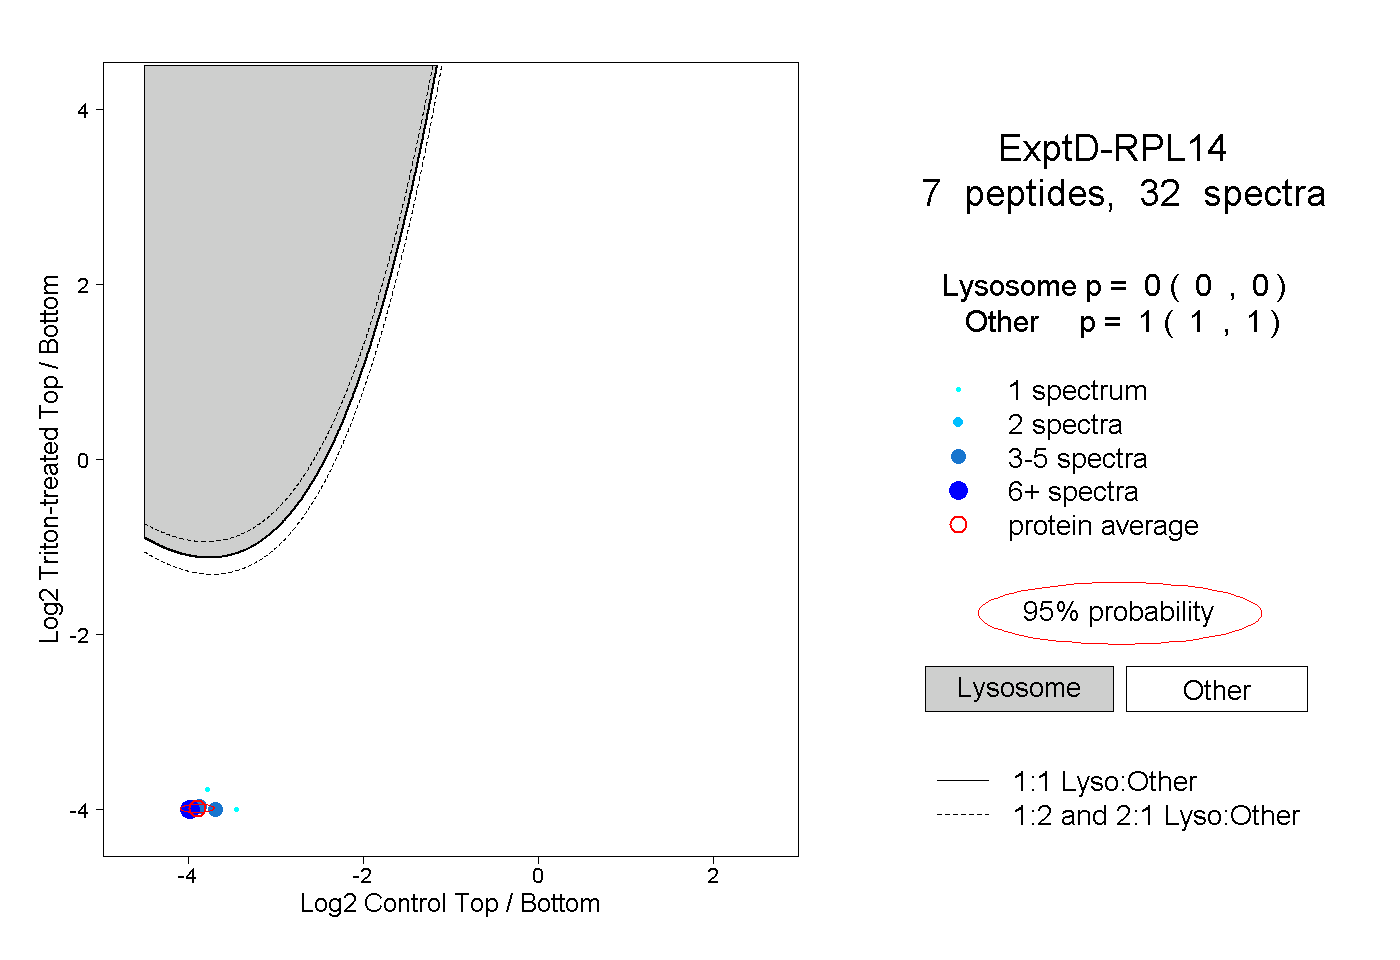
0.000 | 0.000
1.000 | 1.000