 12
12peptides
spectra
0.005 | 0.008
0.000 | 0.000
0.000 | 0.000
0.907 | 0.910
0.000 | 0.000
0.000 | 0.000
0.000 | 0.000
0.083 | 0.086
| Plot | Mito | Lyso | Perox | ER | Golgi | PM | Cytosol | Nucleus | |||||
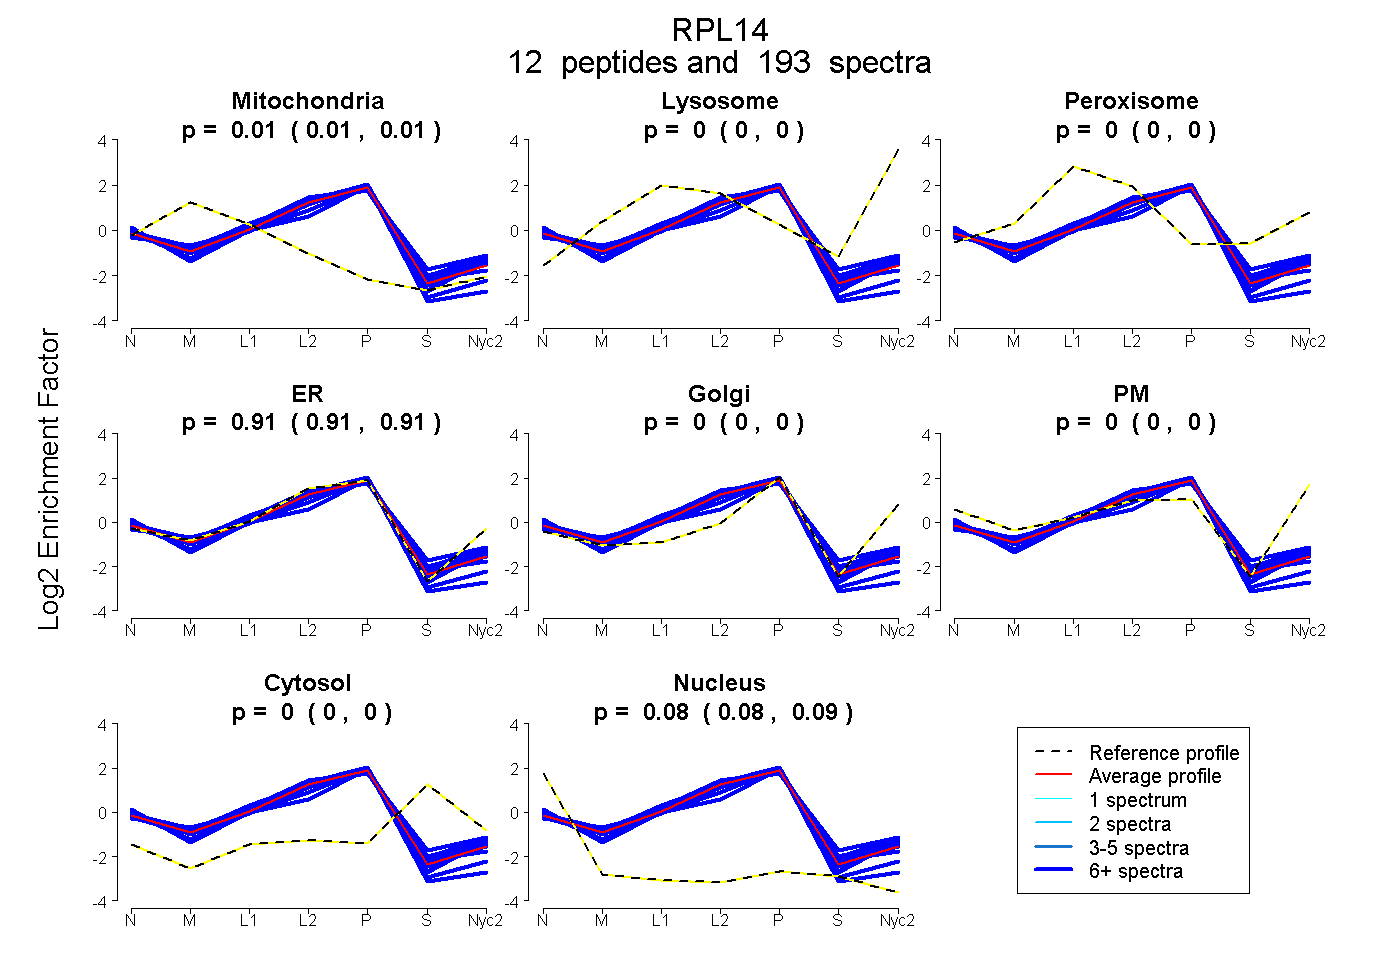
| Expt A |
12 peptides |
193 spectra |
|
0.007 0.005 | 0.008 |
0.000 0.000 | 0.000 |
0.000 0.000 | 0.000 |
0.908 0.907 | 0.910 |
0.000 0.000 | 0.000 |
0.000 0.000 | 0.000 |
0.000 0.000 | 0.000 |
0.085 0.083 | 0.086 |
| 30 spectra, ALVDGPCTR | 0.027 | 0.000 | 0.000 | 0.922 | 0.000 | 0.000 | 0.000 | 0.051 | ||
| 20 spectra, LVAIVDVIDQNR | 0.000 | 0.000 | 0.000 | 0.907 | 0.000 | 0.000 | 0.054 | 0.039 | ||
| 7 spectra, ADINTK | 0.000 | 0.000 | 0.000 | 0.938 | 0.000 | 0.000 | 0.000 | 0.062 | ||
| 10 spectra, VAYISFGPHAGK | 0.045 | 0.000 | 0.005 | 0.871 | 0.000 | 0.000 | 0.051 | 0.029 | ||
| 29 spectra, FPHSAR | 0.050 | 0.000 | 0.000 | 0.906 | 0.000 | 0.000 | 0.000 | 0.044 | ||
| 15 spectra, AAPPAK | 0.000 | 0.000 | 0.000 | 0.836 | 0.000 | 0.000 | 0.027 | 0.137 | ||
| 14 spectra, AAIAAAAAAK | 0.001 | 0.000 | 0.000 | 0.873 | 0.000 | 0.000 | 0.000 | 0.126 | ||
| 7 spectra, CMQLTDFILK | 0.026 | 0.000 | 0.009 | 0.856 | 0.000 | 0.000 | 0.109 | 0.000 | ||
| 18 spectra, FVEVGR | 0.028 | 0.000 | 0.000 | 0.904 | 0.000 | 0.000 | 0.025 | 0.043 | ||
| 11 spectra, QAMPFK | 0.023 | 0.000 | 0.000 | 0.926 | 0.000 | 0.000 | 0.000 | 0.051 | ||
| 16 spectra, MTDFDR | 0.000 | 0.000 | 0.000 | 0.899 | 0.000 | 0.000 | 0.067 | 0.034 | ||
| 16 spectra, ATGPGQK | 0.000 | 0.000 | 0.000 | 0.816 | 0.000 | 0.000 | 0.000 | 0.184 |
| Plot | Mito | Lyso or Perox | ER | Golgi | PM | Cytosol | Nucleus | ||||||
| Expt B |
9 peptides |
61 spectra |
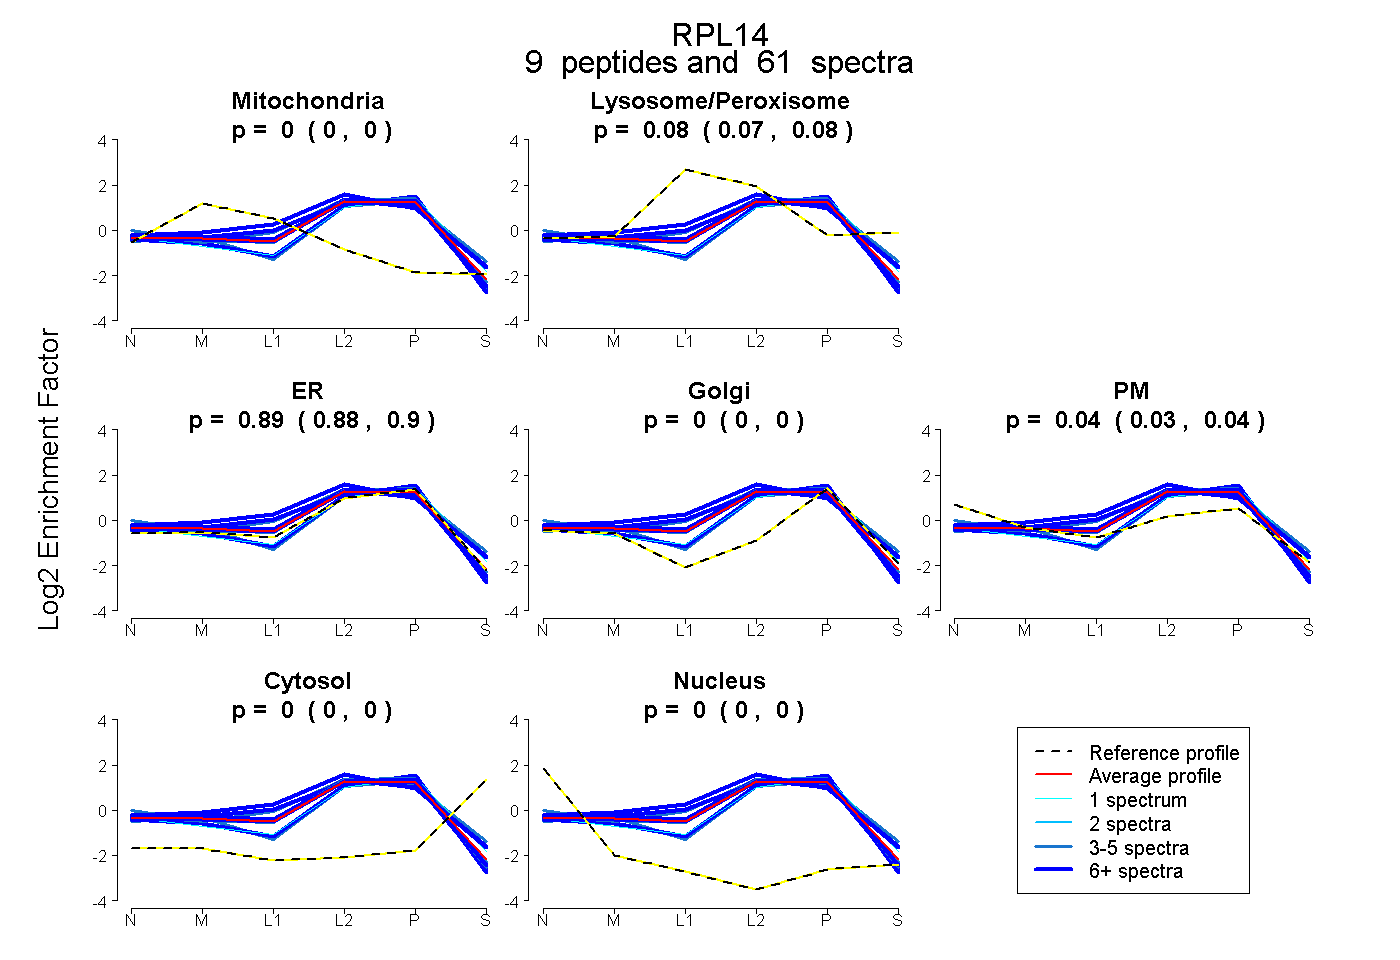 |
0.000 0.000 | 0.000 |
0.076 0.066 | 0.083 |
0.889 0.878 | 0.898 |
0.000 0.000 | 0.000 |
0.035 0.026 | 0.043 |
0.000 0.000 | 0.000 |
0.000 0.000 | 0.000 |
|||
| Plot | Lyso | Other | |||||||||||
| Expt C |
11 peptides |
241 spectra |
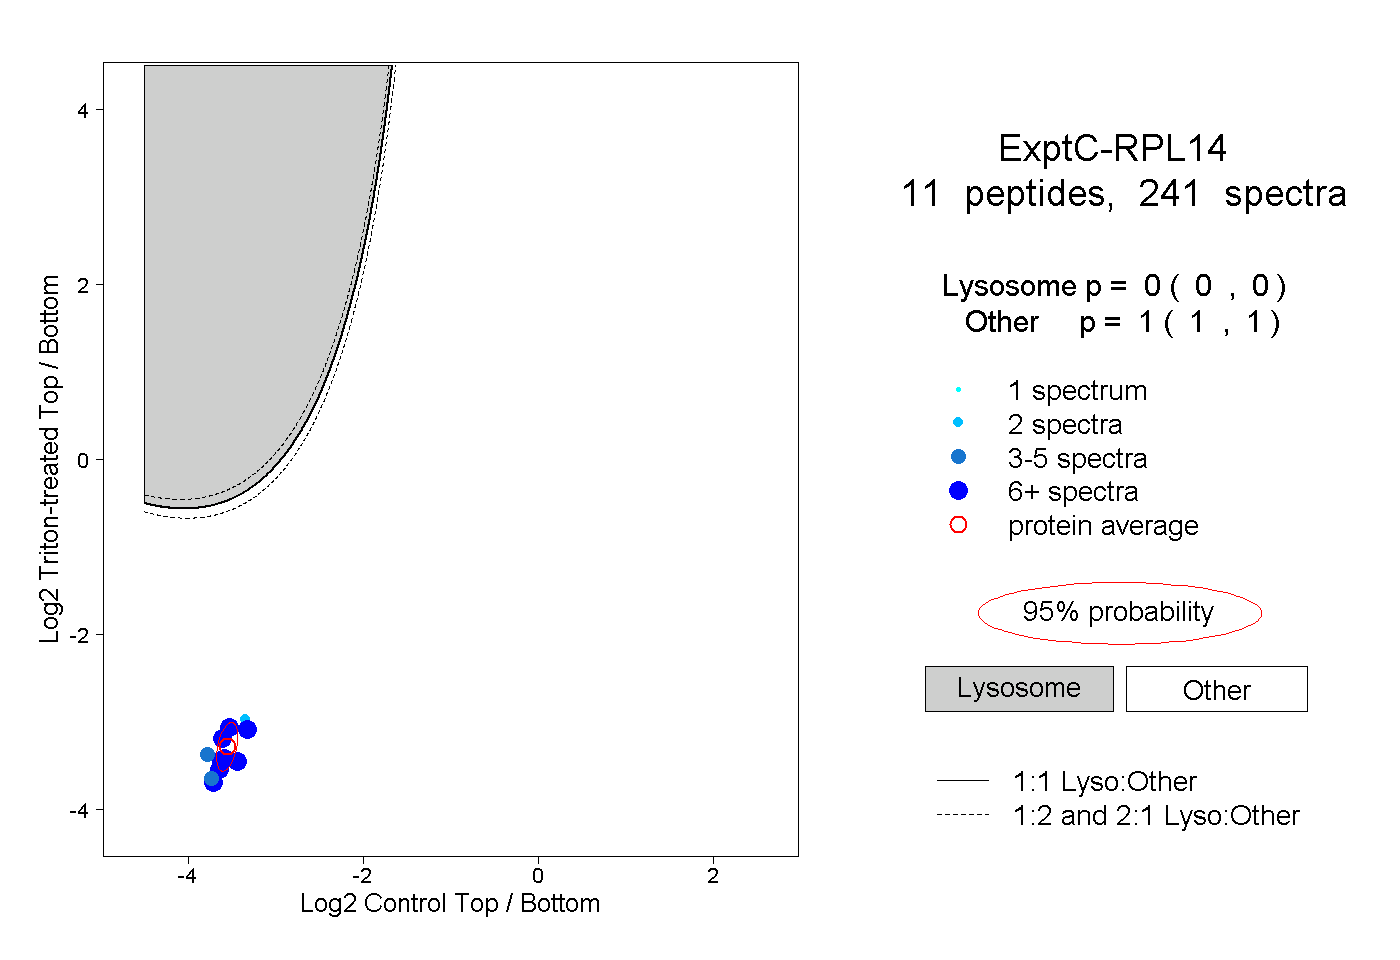 |
0.000 0.000 | 0.000 |
1.000 1.000 | 1.000 |
||||||||
| Plot | Lyso | Other | |||||||||||
| Expt D |
7 peptides |
32 spectra |
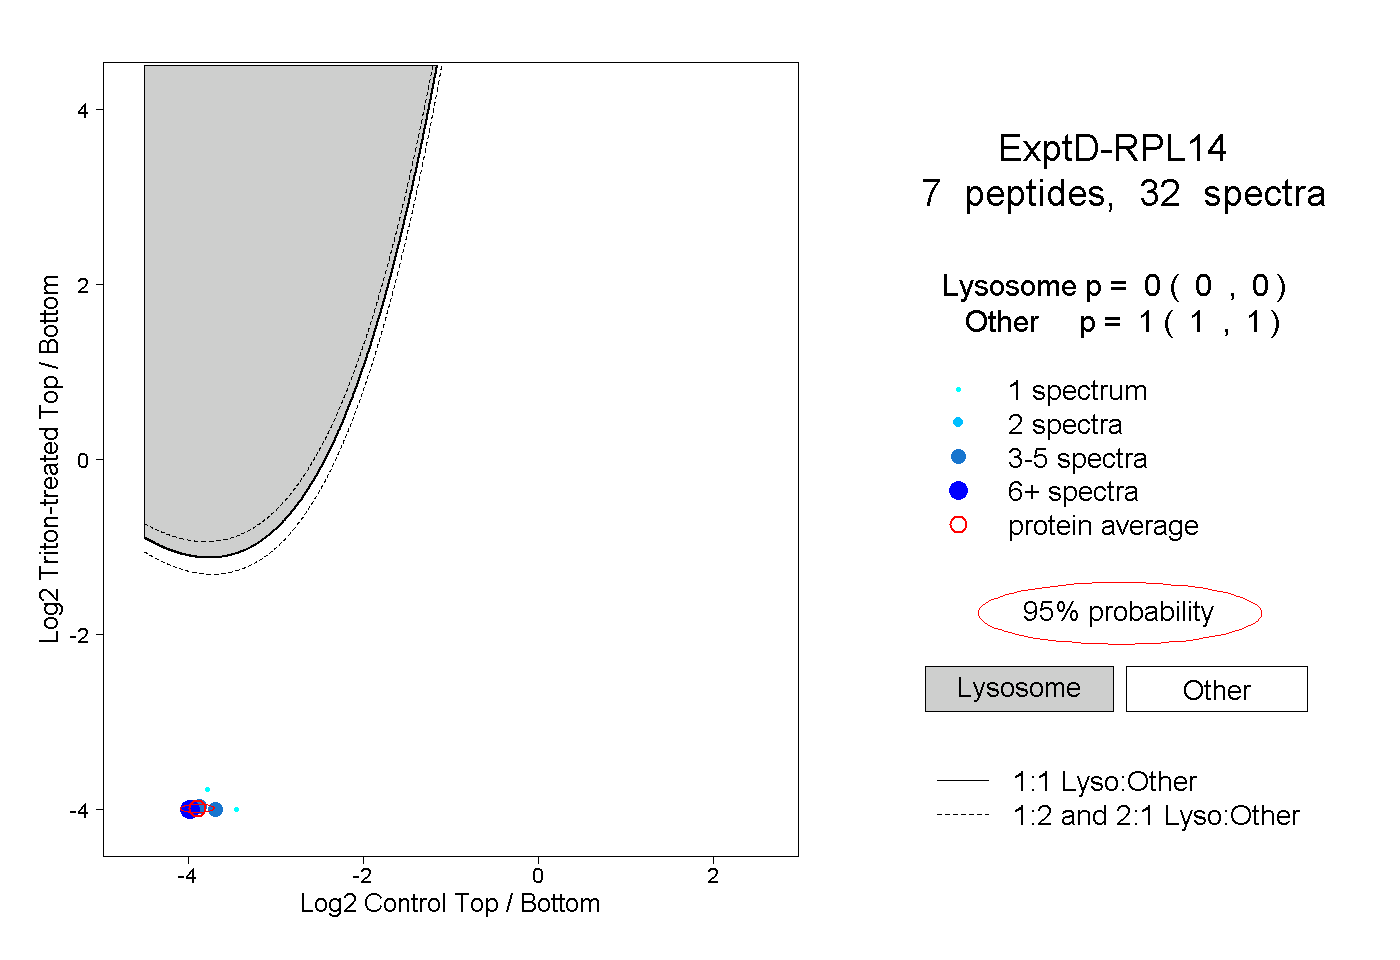 |
0.000 0.000 | 0.000 |
1.000 1.000 | 1.000 |