RPL14
[ENSRNOP00000061747]
Main page
| | | Plot |
Mito |
Lyso |
|
Perox |
ER |
Golgi |
PM |
Cytosol |
Nucleus |
|
| Expt A |
 12
12
peptides |
193
spectra |
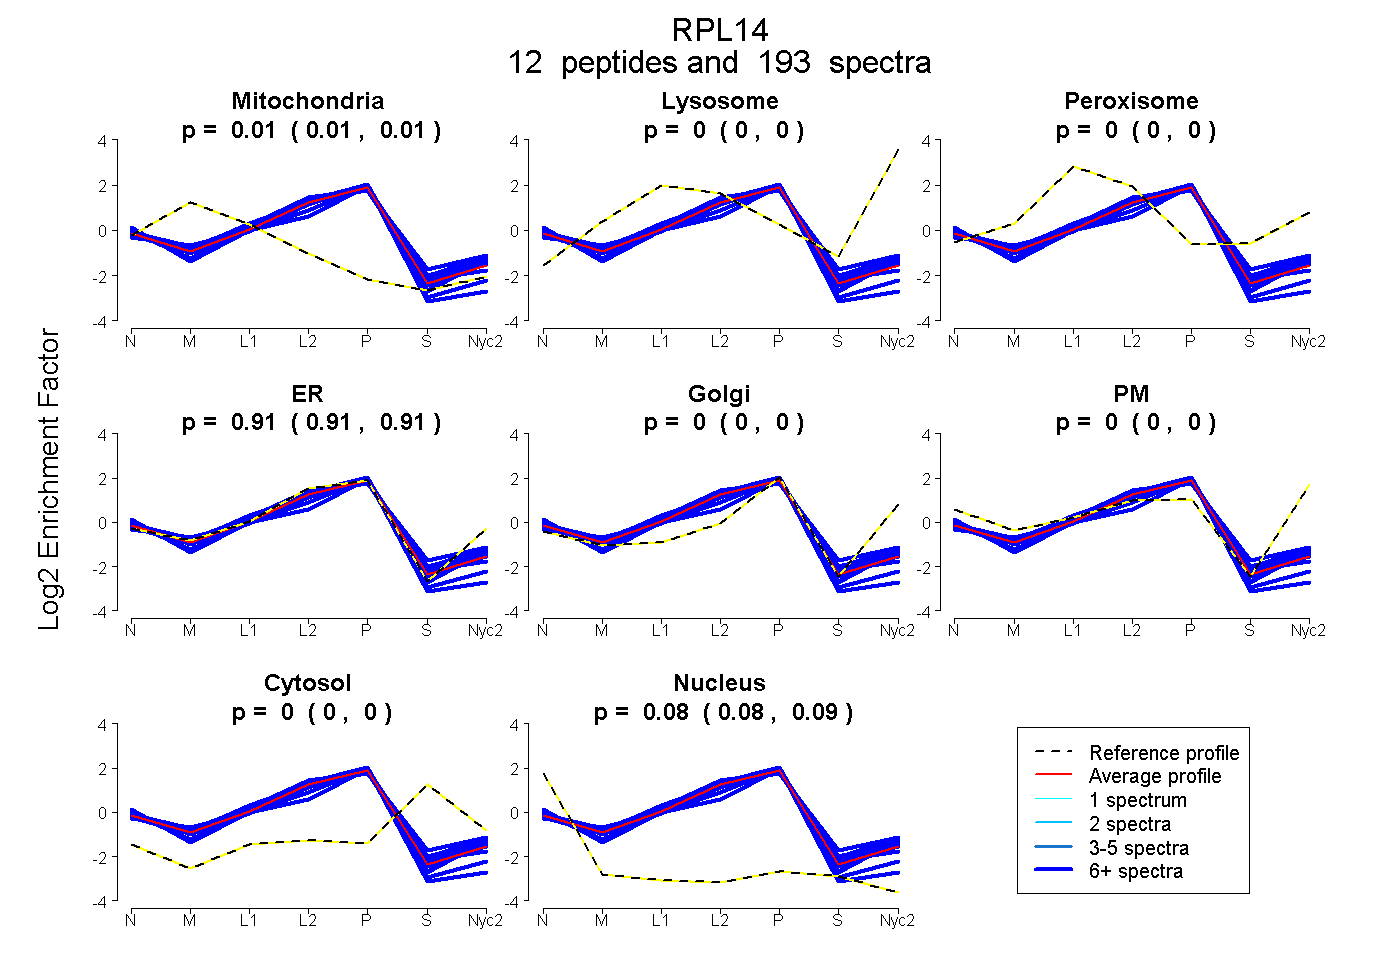 |
0.007
0.005 | 0.008 |
0.000
0.000 | 0.000 |
|
0.000
0.000 | 0.000 |
0.908
0.907 | 0.910 |
0.000
0.000 | 0.000 |
0.000
0.000 | 0.000 |
0.000
0.000 | 0.000 |
0.085
0.083 | 0.086 |
|
| | | Plot |
Mito |
|
Lyso or Perox |
|
ER |
Golgi |
PM |
Cytosol |
Nucleus |
|
| Expt B |
9
peptides |
61
spectra |
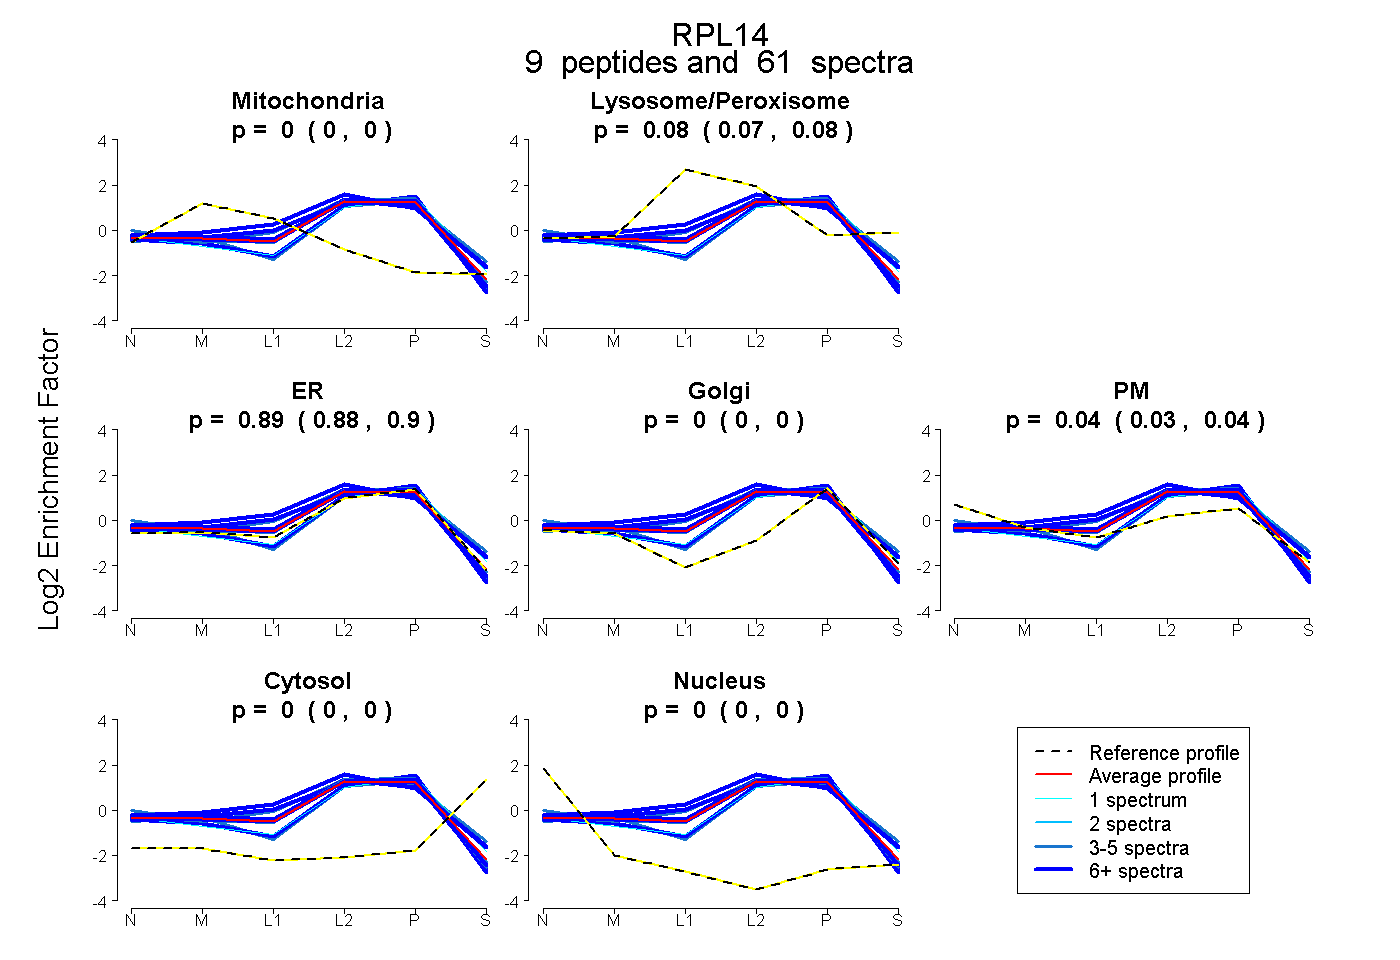 |
0.000
0.000 | 0.000 |
|
0.076
0.066 | 0.083 |
|
0.889
0.878 | 0.898 |
0.000
0.000 | 0.000 |
0.035
0.026 | 0.043 |
0.000
0.000 | 0.000 |
0.000
0.000 | 0.000 |
|
| 5 spectra, ALVDGPCTR |
0.000 |
|
0.243 |
|
0.586 |
0.000 |
0.171 |
0.000 |
0.000 |
|
| 13 spectra, LVAIVDVIDQNR |
0.000 |
|
0.040 |
|
0.960 |
0.000 |
0.000 |
0.000 |
0.000 |
|
| 7 spectra, VAYISFGPHAGK |
0.000 |
|
0.309 |
|
0.653 |
0.000 |
0.038 |
0.000 |
0.000 |
|
| 11 spectra, FPHSAR |
0.021 |
|
0.119 |
|
0.860 |
0.000 |
0.000 |
0.000 |
0.000 |
|
| 7 spectra, AAPPAK |
0.000 |
|
0.000 |
|
0.968 |
0.032 |
0.000 |
0.000 |
0.000 |
|
| 5 spectra, AAIAAAAAAK |
0.000 |
|
0.000 |
|
0.908 |
0.092 |
0.000 |
0.000 |
0.000 |
|
| 7 spectra, CMQLTDFILK |
0.000 |
|
0.170 |
|
0.782 |
0.000 |
0.047 |
0.001 |
0.000 |
|
| 5 spectra, FVEVGR |
0.000 |
|
0.027 |
|
0.973 |
0.000 |
0.000 |
0.000 |
0.000 |
|
| 1 spectrum, ATGPGQK |
0.000 |
|
0.000 |
|
0.884 |
0.041 |
0.051 |
0.025 |
0.000 |
|
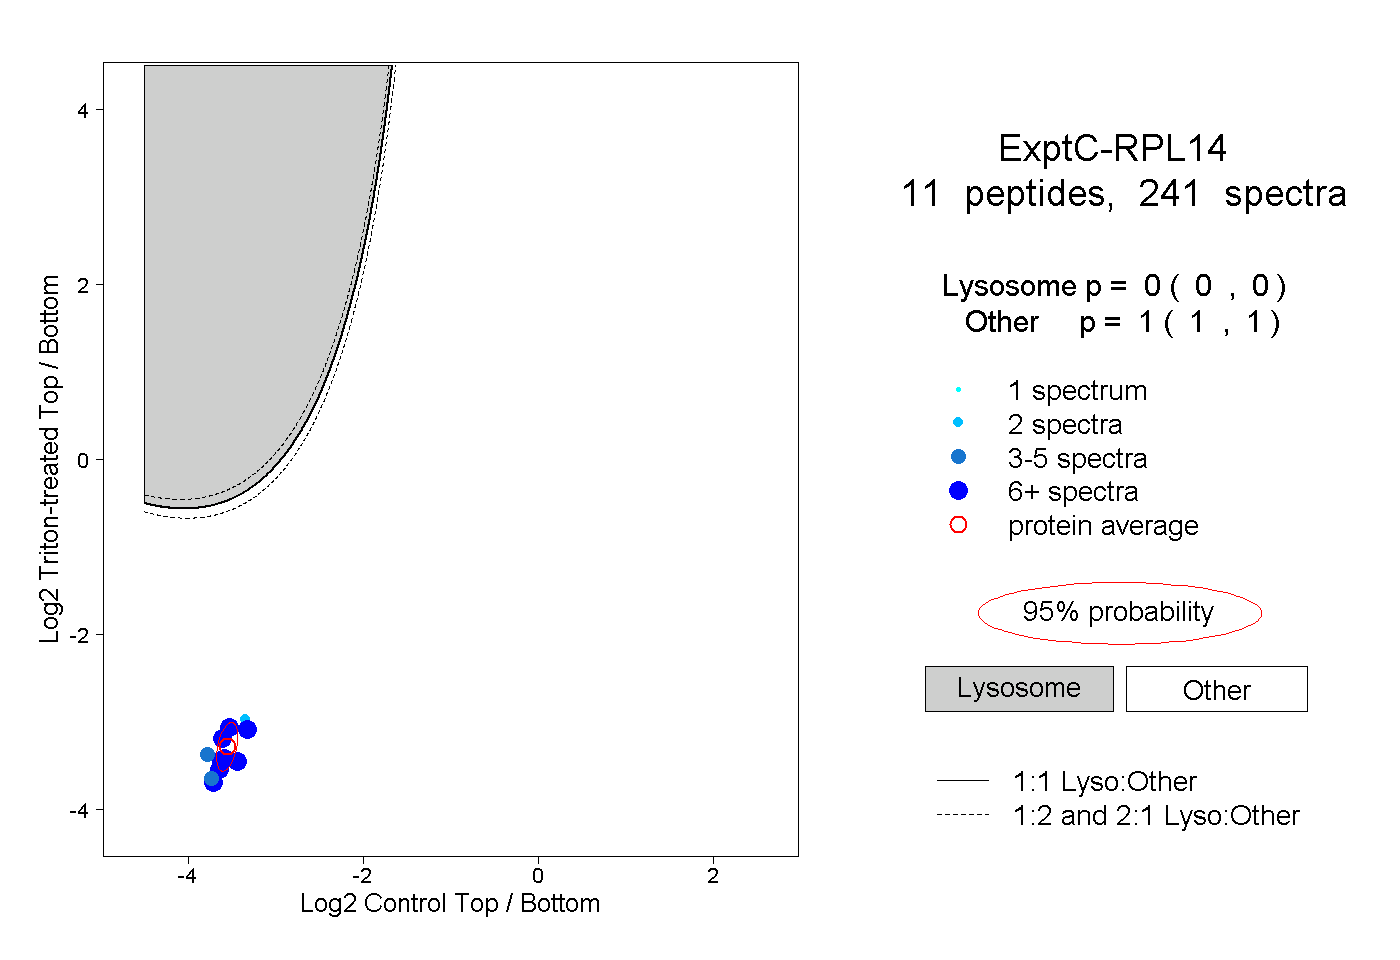
| | | Plot |
|
Lyso |
|
|
|
|
|
|
|
Other |
| Expt C |
11
peptides |
241
spectra |
 |
|
0.000
0.000 | 0.000 |
|
|
|
|
|
|
|
1.000
1.000 | 1.000 |
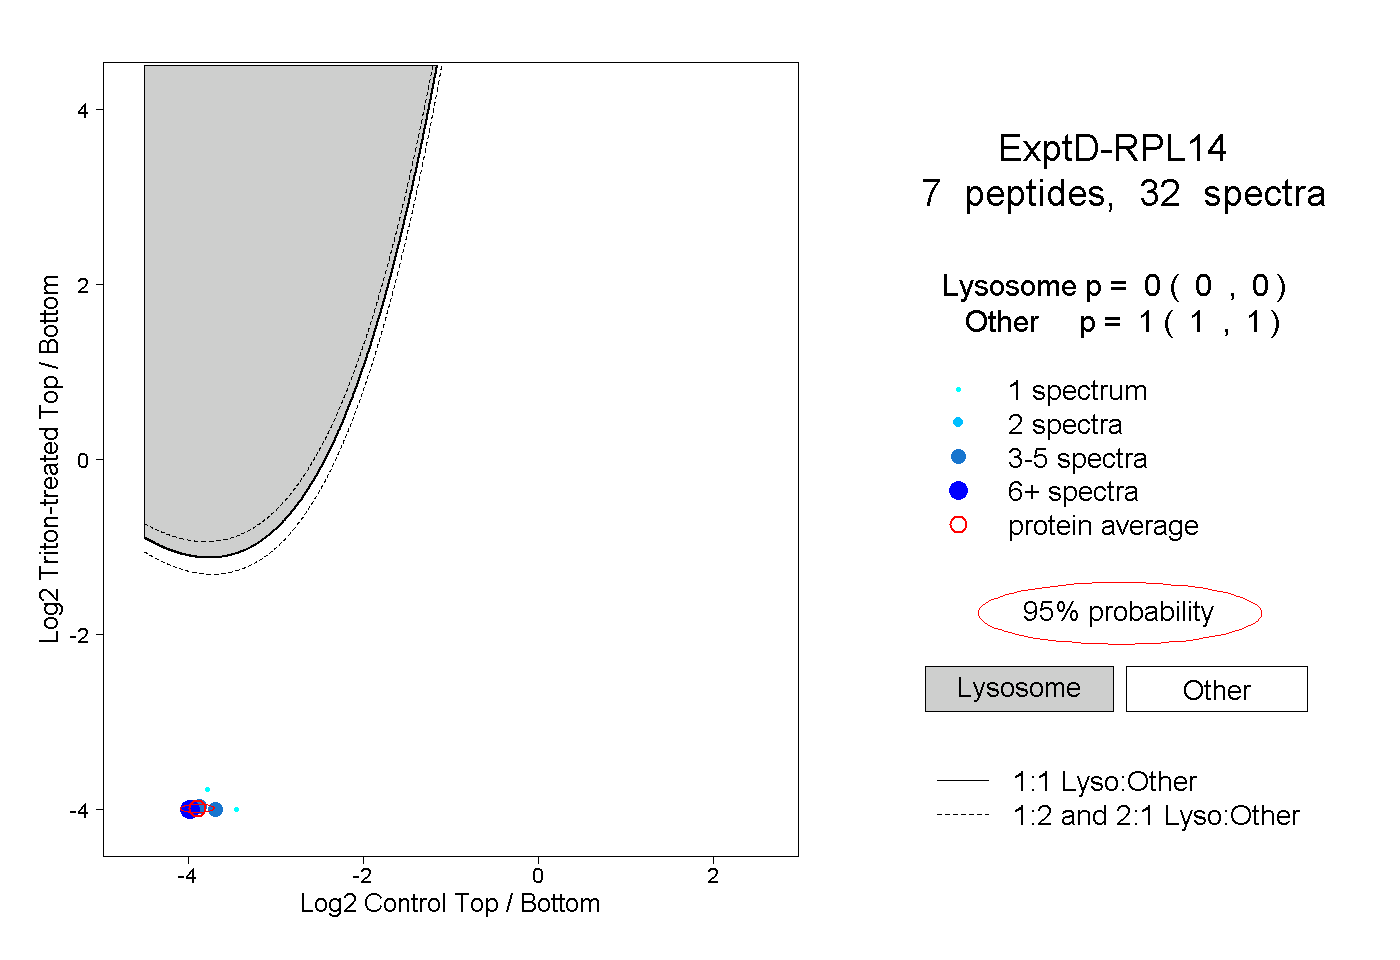
| | | Plot |
|
Lyso |
|
|
|
|
|
|
|
Other |
| Expt D |
7
peptides |
32
spectra |
 |
|
0.000
0.000 | 0.000 |
|
|
|
|
|
|
|
1.000
1.000 | 1.000 |