 11
11peptides
spectra
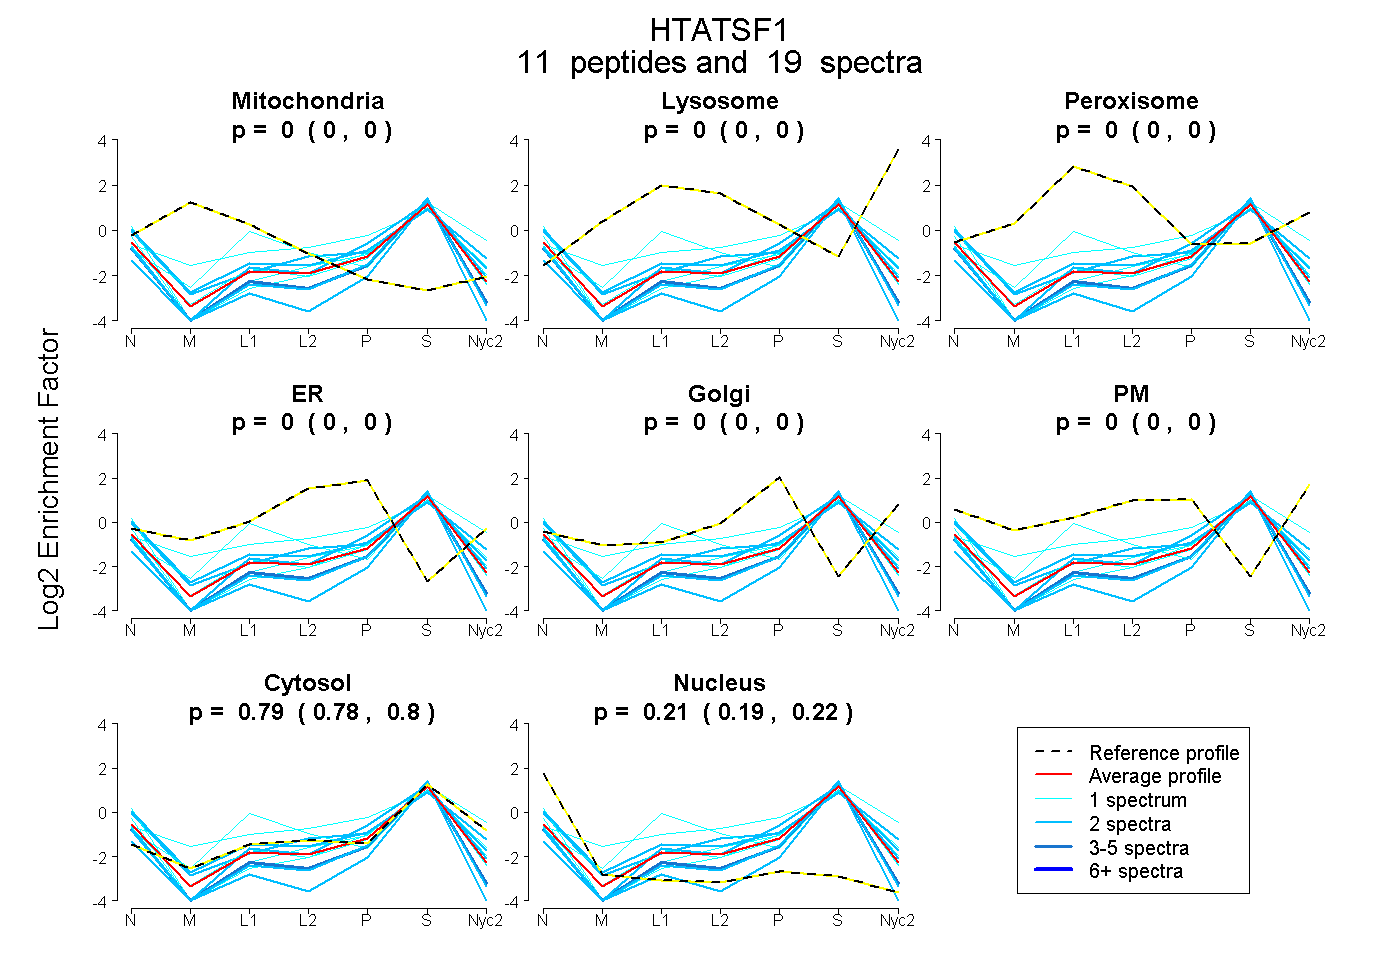
0.000 | 0.000
0.000 | 0.000
0.000 | 0.000
0.000 | 0.000
0.000 | 0.000
0.000 | 0.000
0.780 | 0.803
0.195 | 0.218
3peptides
spectra
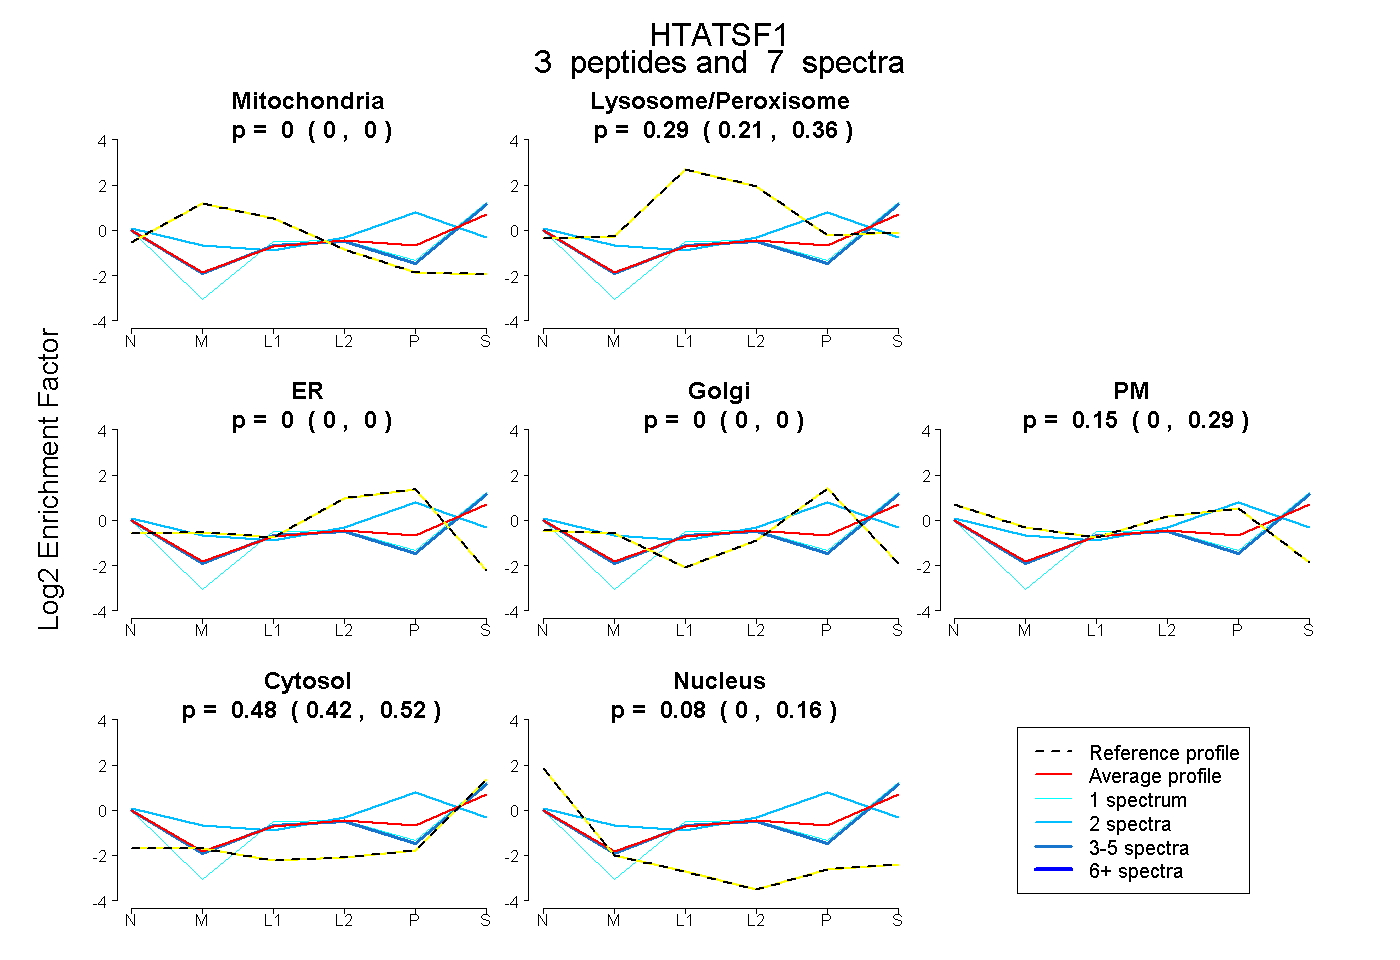
0.000 | 0.000
0.215 | 0.358
0.000 | 0.000
0.000 | 0.000
0.000 | 0.286
0.419 | 0.525
0.000 | 0.159
2peptides
spectra
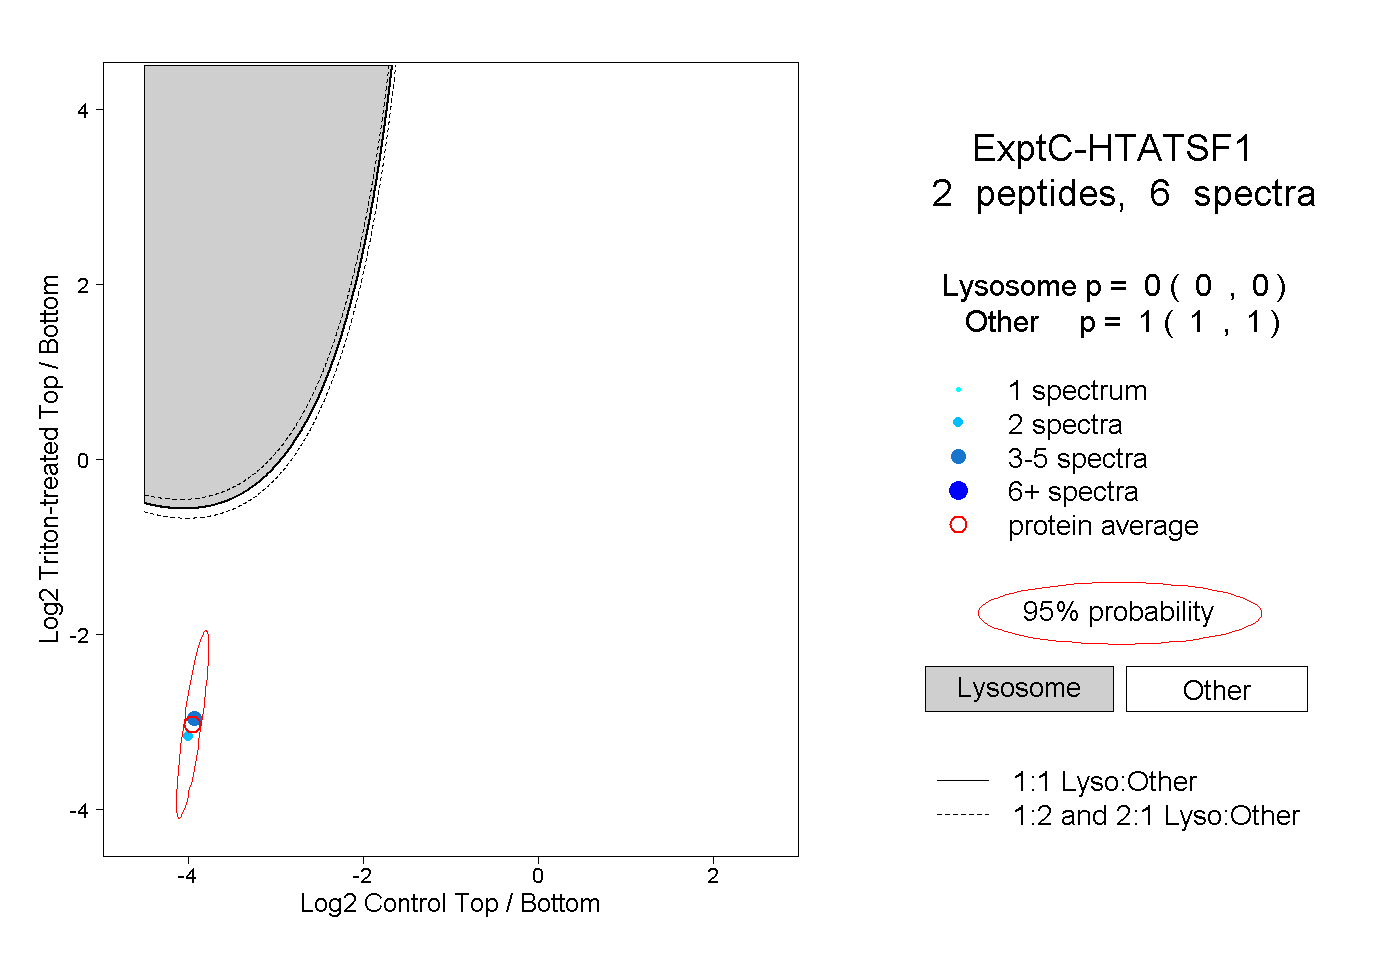
0.000 | 0.000
1.000 | 1.000
1peptide
spectrum
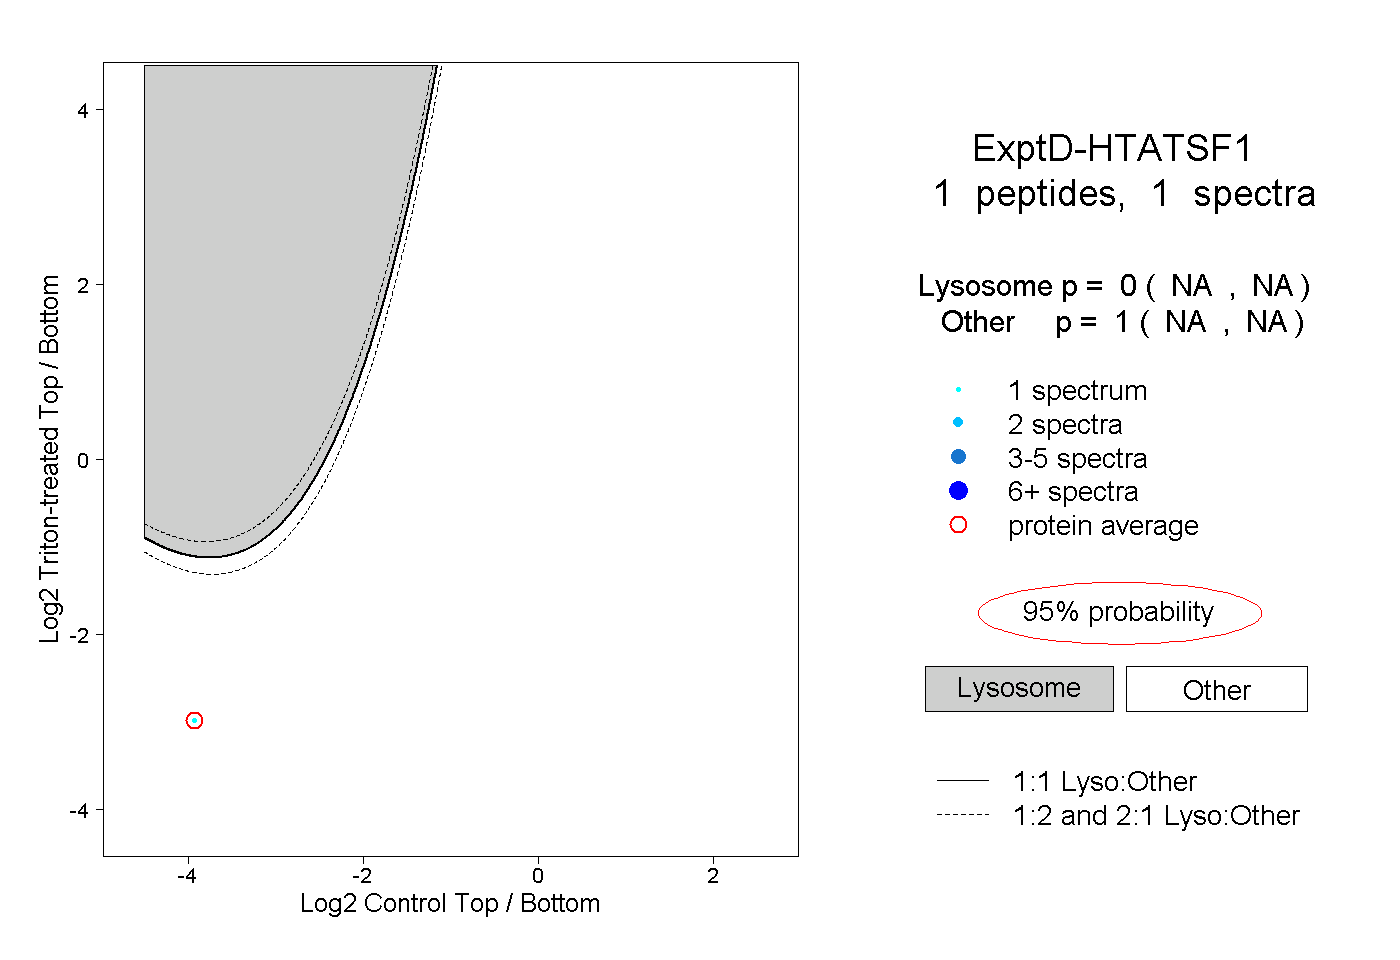
NA | NA
NA | NA