 11
11peptides
spectra
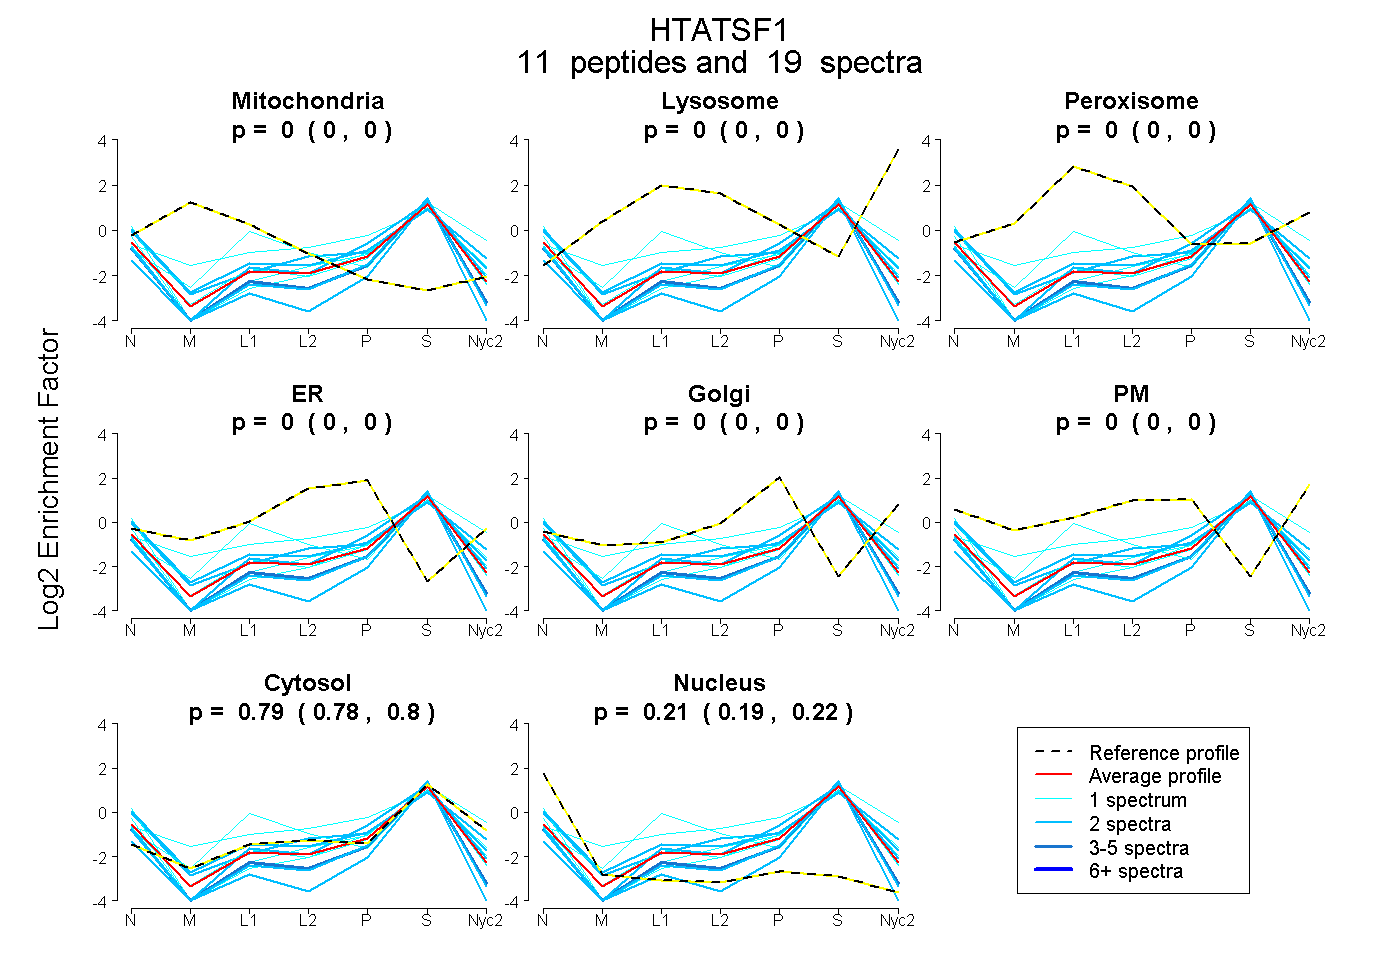
0.000 | 0.000
0.000 | 0.000
0.000 | 0.000
0.000 | 0.000
0.000 | 0.000
0.000 | 0.000
0.780 | 0.803
0.195 | 0.218
| Plot | Mito | Lyso | Perox | ER | Golgi | PM | Cytosol | Nucleus | |||||
| Expt A |
11 peptides |
19 spectra |
|
0.000 0.000 | 0.000 |
0.000 0.000 | 0.000 |
0.000 0.000 | 0.000 |
0.000 0.000 | 0.000 |
0.000 0.000 | 0.000 |
0.000 0.000 | 0.000 |
0.792 0.780 | 0.803 |
0.208 0.195 | 0.218 |
| 2 spectra, AESGWFHVEEDR | 0.000 | 0.000 | 0.000 | 0.039 | 0.000 | 0.000 | 0.781 | 0.180 | ||
| 1 spectrum, ELELEEGNPK | 0.000 | 0.000 | 0.000 | 0.000 | 0.000 | 0.000 | 0.711 | 0.289 | ||
| 2 spectra, TVEEPPQK | 0.000 | 0.000 | 0.000 | 0.000 | 0.000 | 0.000 | 0.848 | 0.152 | ||
| 1 spectrum, LHVEVAQFQLK | 0.000 | 0.000 | 0.133 | 0.000 | 0.000 | 0.000 | 0.750 | 0.117 | ||
| 2 spectra, NMFHPMDFEDDPLVLNEIR | 0.000 | 0.000 | 0.000 | 0.000 | 0.000 | 0.000 | 0.733 | 0.267 | ||
| 1 spectrum, GWEAFLNAPEANR | 0.067 | 0.000 | 0.000 | 0.192 | 0.000 | 0.000 | 0.741 | 0.000 | ||
| 1 spectrum, MQELYGDPK | 0.000 | 0.000 | 0.000 | 0.000 | 0.000 | 0.000 | 0.926 | 0.074 | ||
| 2 spectra, LLDEDEIR | 0.000 | 0.000 | 0.000 | 0.000 | 0.000 | 0.000 | 0.566 | 0.434 | ||
| 1 spectrum, GEYDASK | 0.000 | 0.000 | 0.000 | 0.000 | 0.000 | 0.000 | 0.761 | 0.239 | ||
| 2 spectra, LFNEEEGPNEK | 0.000 | 0.000 | 0.000 | 0.000 | 0.000 | 0.063 | 0.777 | 0.160 | ||
| 4 spectra, IILFDR | 0.000 | 0.000 | 0.000 | 0.000 | 0.000 | 0.000 | 0.701 | 0.299 |
| Plot | Mito | Lyso or Perox | ER | Golgi | PM | Cytosol | Nucleus | ||||||
| Expt B |
3 peptides |
7 spectra |
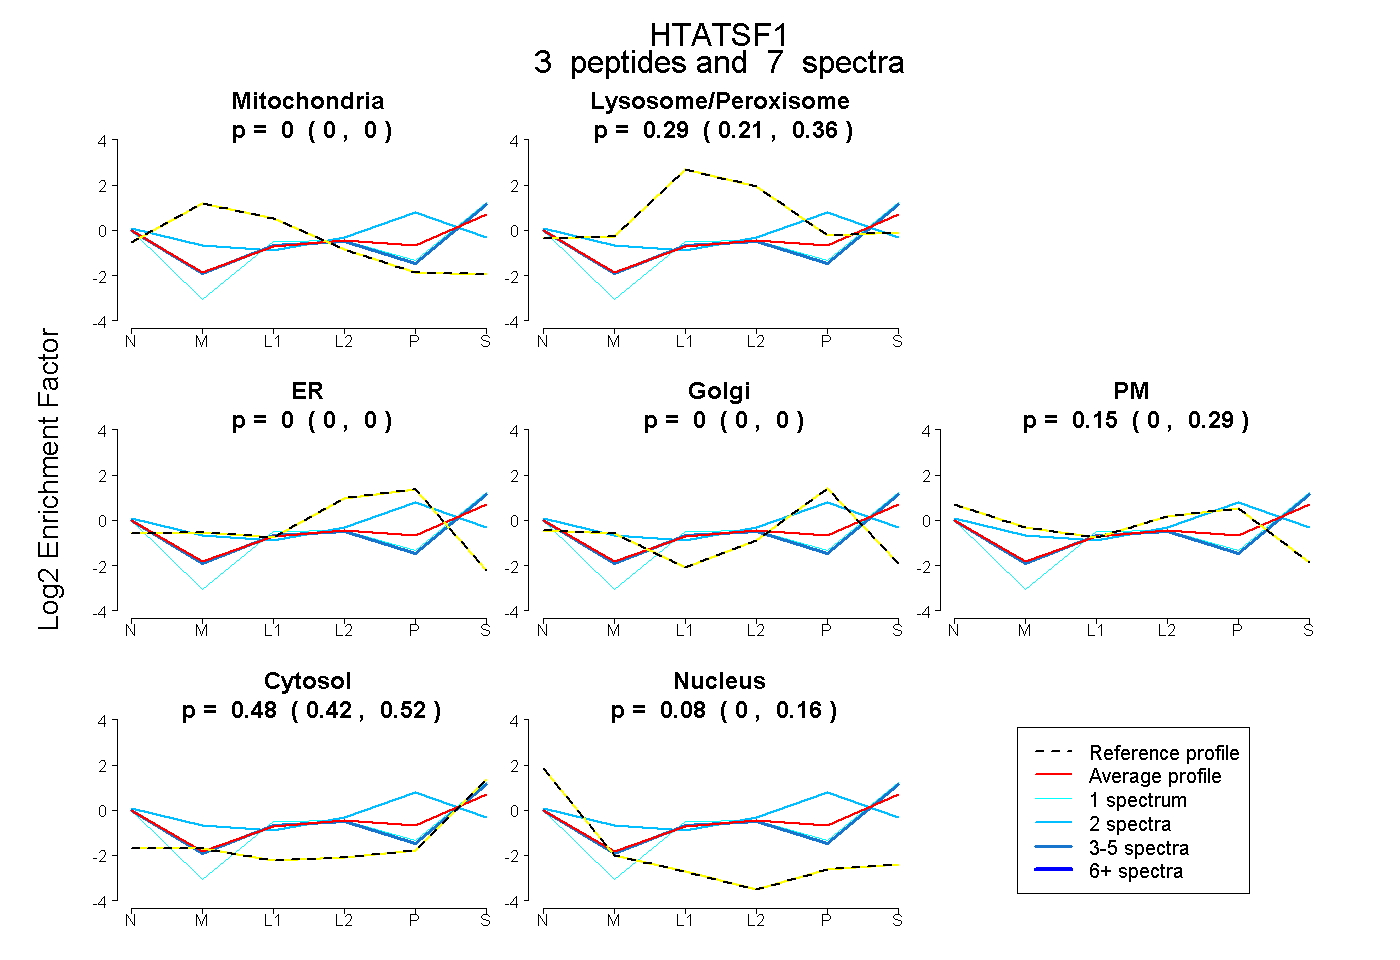 |
0.000 0.000 | 0.000 |
0.292 0.215 | 0.358 |
0.000 0.000 | 0.000 |
0.000 0.000 | 0.000 |
0.152 0.000 | 0.286 |
0.477 0.419 | 0.525 |
0.078 0.000 | 0.159 |
|||
| Plot | Lyso | Other | |||||||||||
| Expt C |
2 peptides |
6 spectra |
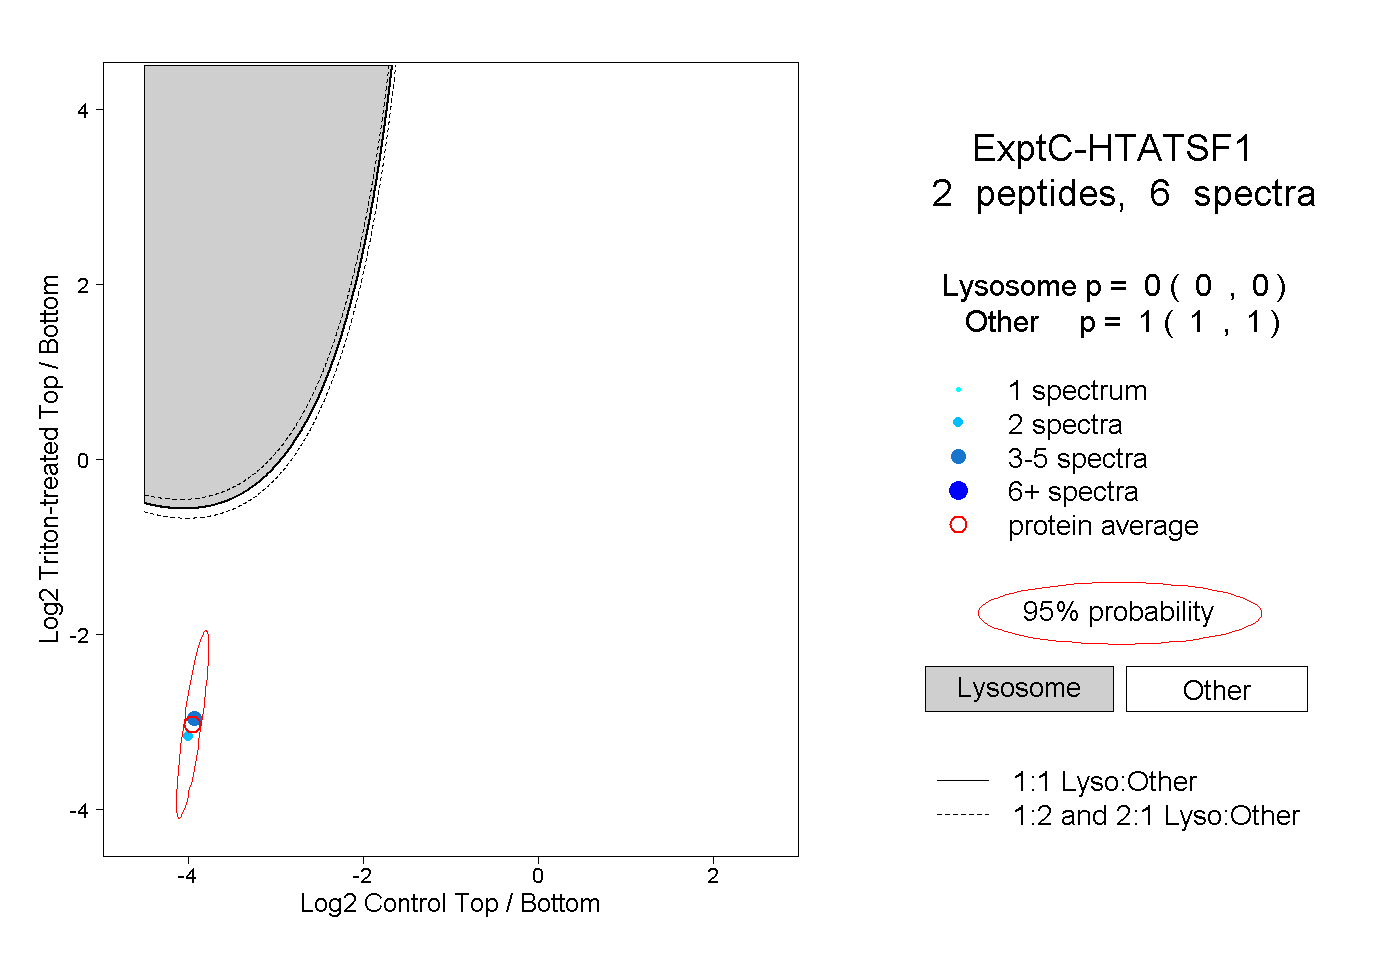 |
0.000 0.000 | 0.000 |
1.000 1.000 | 1.000 |
||||||||
| Plot | Lyso | Other | |||||||||||
| Expt D |
1 peptide |
1 spectrum |
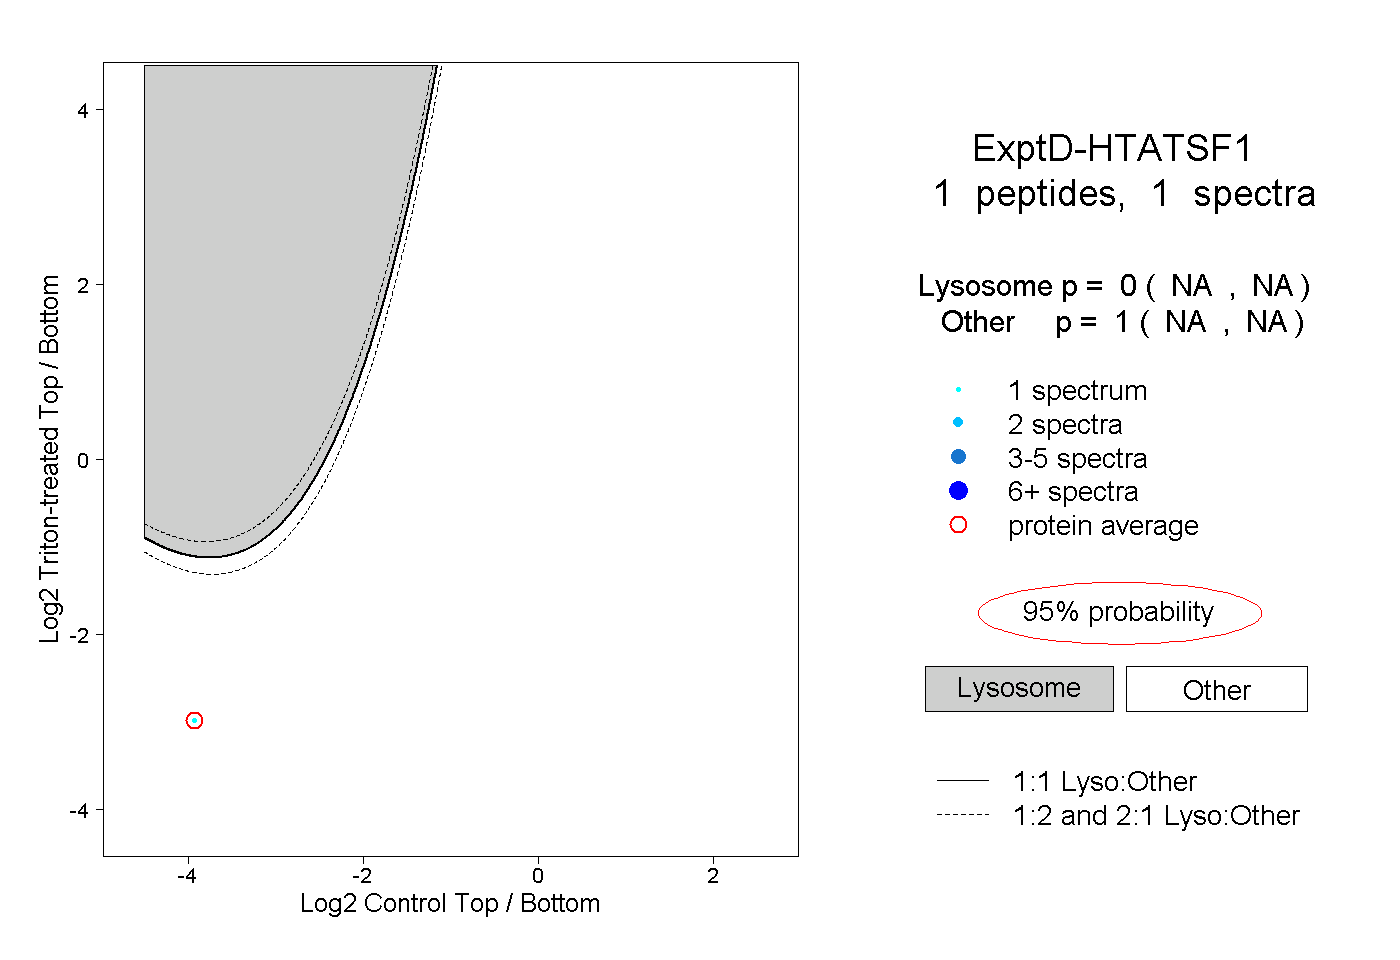 |
0.000 NA | NA |
1.000 NA | NA |