HTATSF1
[ENSRNOP00000061583]
Main page
| | | Plot |
Mito |
Lyso |
|
Perox |
ER |
Golgi |
PM |
Cytosol |
Nucleus |
|
| Expt A |
 11
11
peptides |
19
spectra |
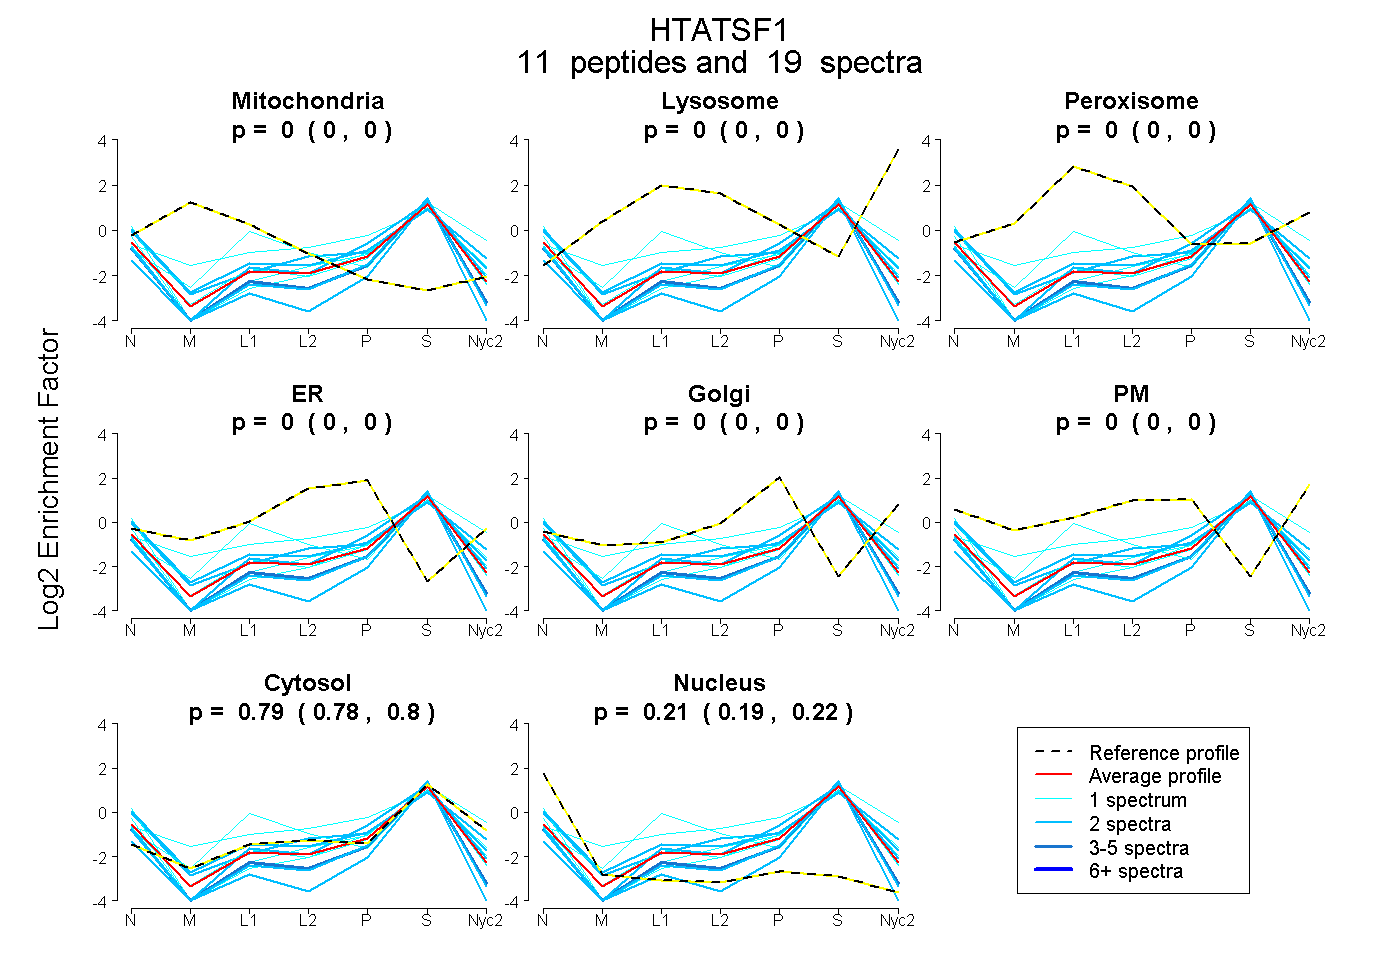 |
0.000
0.000 | 0.000 |
0.000
0.000 | 0.000 |
|
0.000
0.000 | 0.000 |
0.000
0.000 | 0.000 |
0.000
0.000 | 0.000 |
0.000
0.000 | 0.000 |
0.792
0.780 | 0.803 |
0.208
0.195 | 0.218 |
|
| | | Plot |
Mito |
|
Lyso or Perox |
|
ER |
Golgi |
PM |
Cytosol |
Nucleus |
|
| Expt B |
3
peptides |
7
spectra |
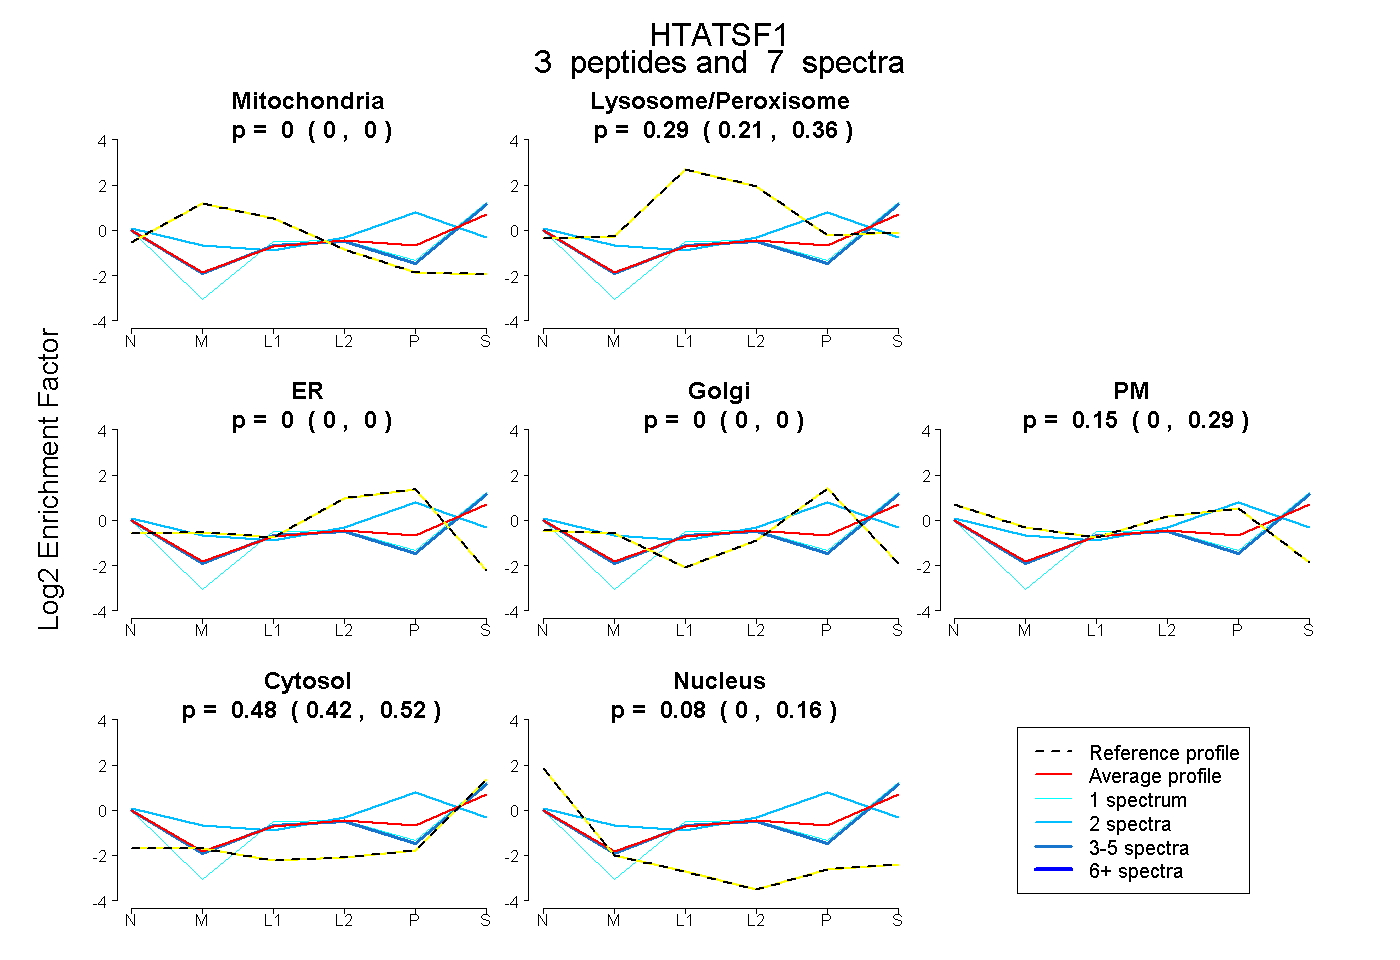 |
0.000
0.000 | 0.000 |
|
0.292
0.215 | 0.358 |
|
0.000
0.000 | 0.000 |
0.000
0.000 | 0.000 |
0.152
0.000 | 0.286 |
0.477
0.419 | 0.525 |
0.078
0.000 | 0.159 |
|
| 1 spectrum, ESGEGCPER |
0.000 |
|
0.333 |
|
0.000 |
0.000 |
0.000 |
0.559 |
0.108 |
|
| 4 spectra, LLDEDEIR |
0.000 |
|
0.340 |
|
0.000 |
0.000 |
0.000 |
0.544 |
0.116 |
|
| 2 spectra, IILFDR |
0.000 |
|
0.201 |
|
0.000 |
0.383 |
0.237 |
0.179 |
0.000 |
|
| | | Plot |
|
Lyso |
|
|
|
|
|
|
|
Other |
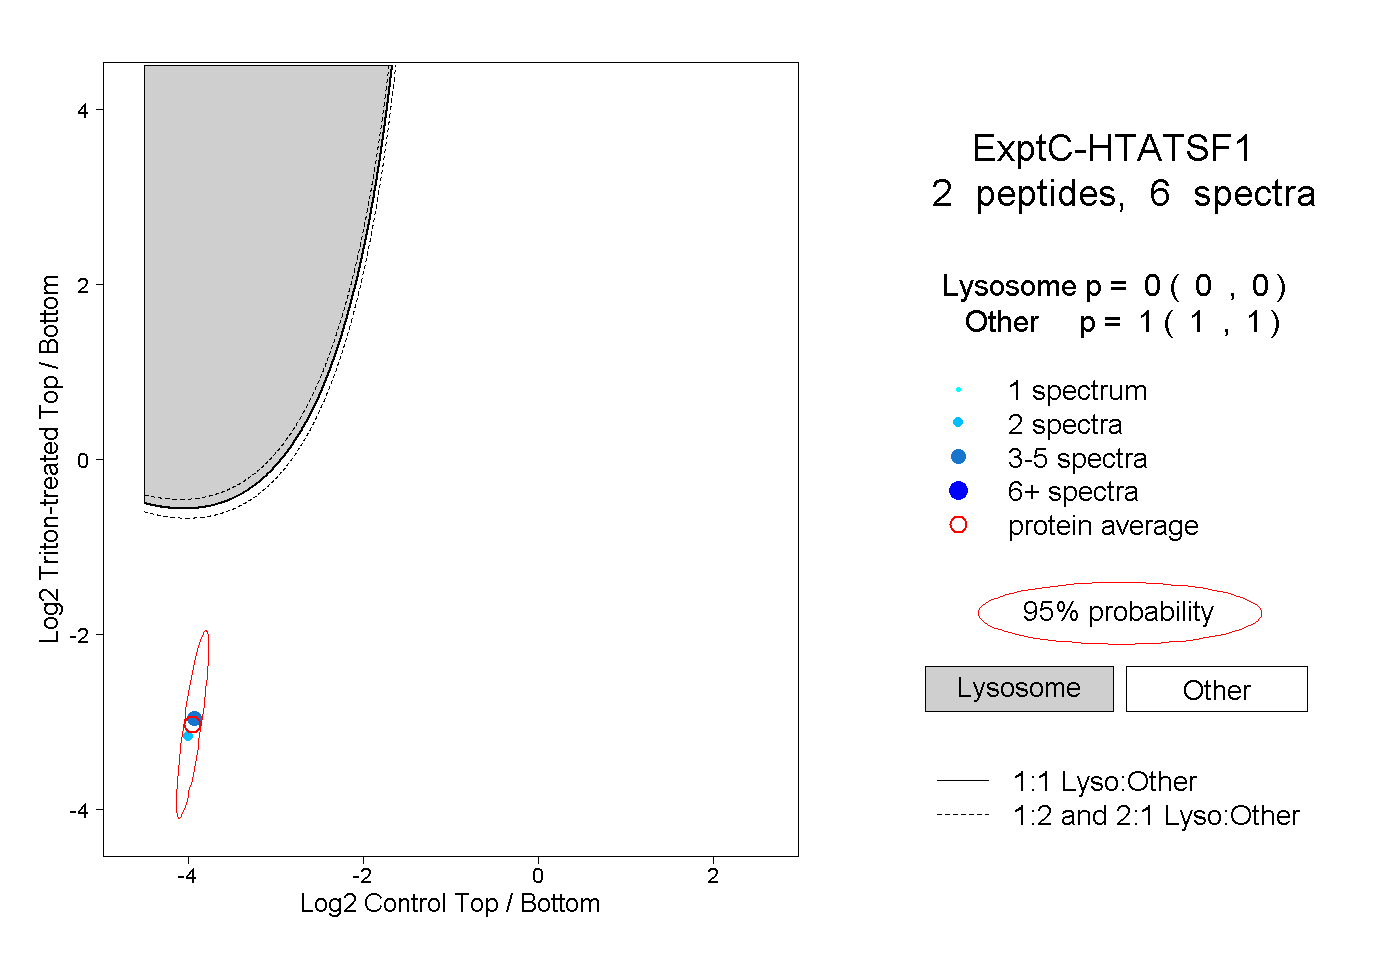
| Expt C |
2
peptides |
6
spectra |
 |
|
0.000
0.000 | 0.000 |
|
|
|
|
|
|
|
1.000
1.000 | 1.000 |
| | | Plot |
|
Lyso |
|
|
|
|
|
|
|
Other |
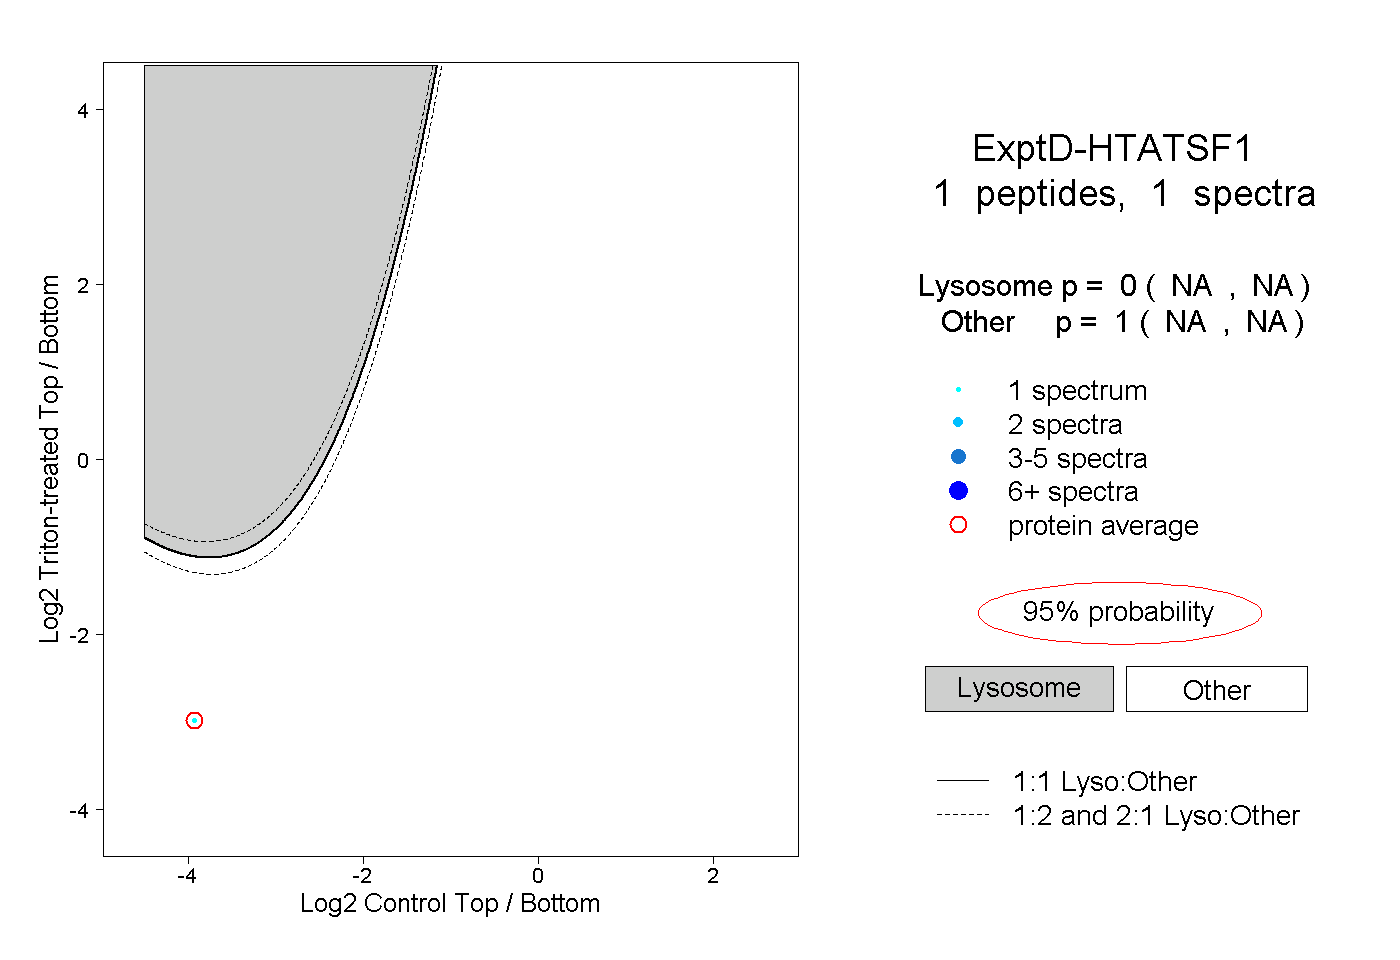
| Expt D |
1
peptide |
1
spectrum |
 |
|
0.000
NA | NA |
|
|
|
|
|
|
|
1.000
NA | NA |