 12
12peptides
spectra
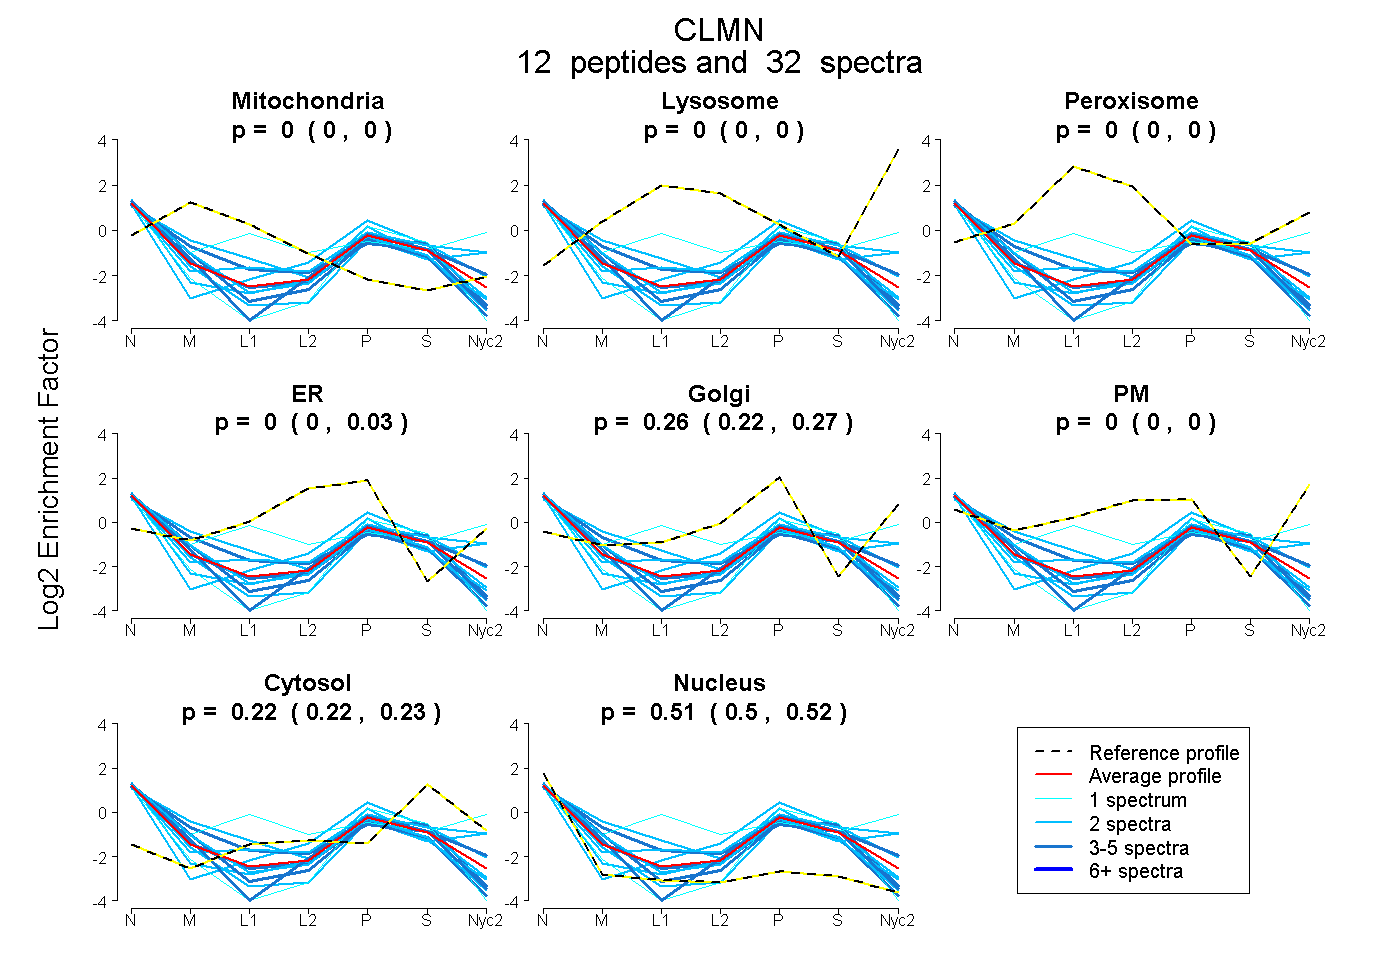
0.000 | 0.000
0.000 | 0.000
0.000 | 0.000
0.000 | 0.025
0.224 | 0.271
0.000 | 0.000
0.218 | 0.230
0.501 | 0.521
3peptides
spectra
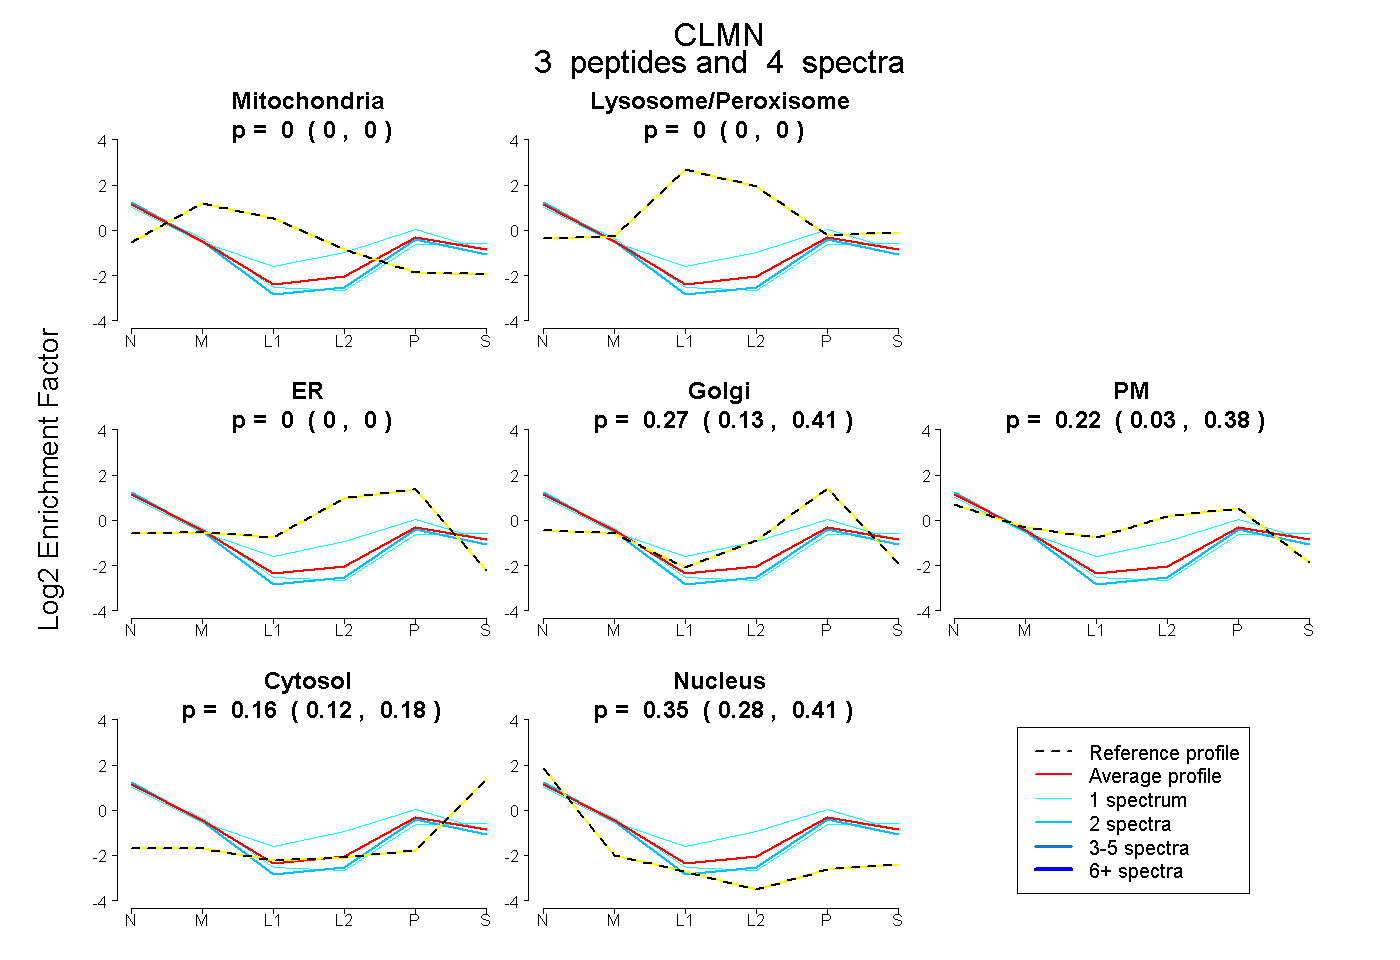
0.000 | 0.000
0.000 | 0.000
0.000 | 0.000
0.126 | 0.405
0.030 | 0.376
0.123 | 0.181
0.282 | 0.405
3peptides
spectra
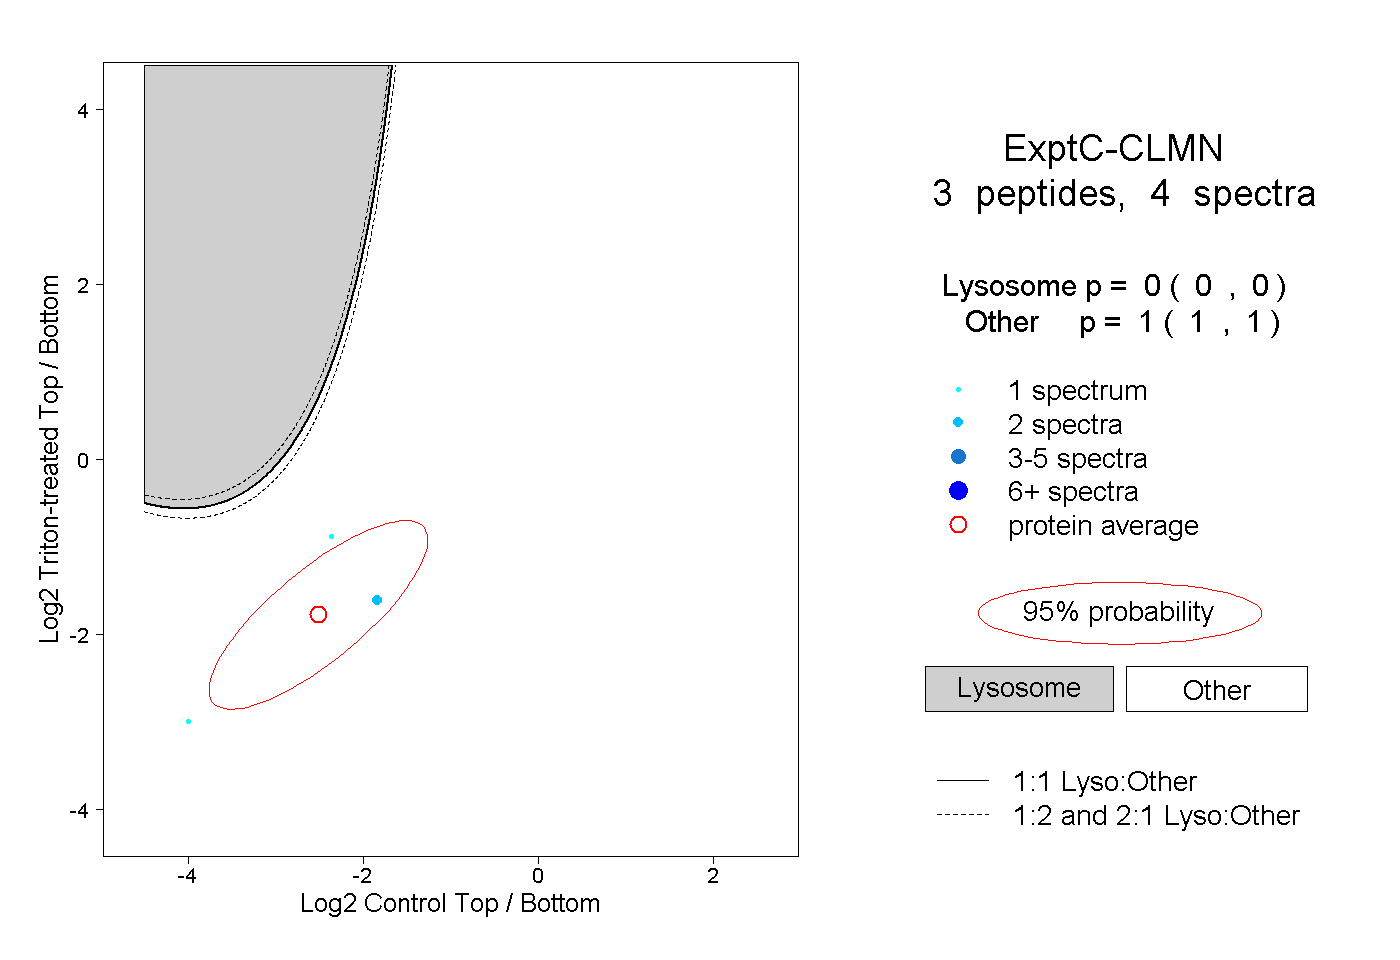
0.000 | 0.000
1.000 | 1.000