CLMN
[ENSRNOP00000061235]
Main page
| | | Plot |
Mito |
Lyso |
|
Perox |
ER |
Golgi |
PM |
Cytosol |
Nucleus |
|
| Expt A |
 12
12
peptides |
32
spectra |
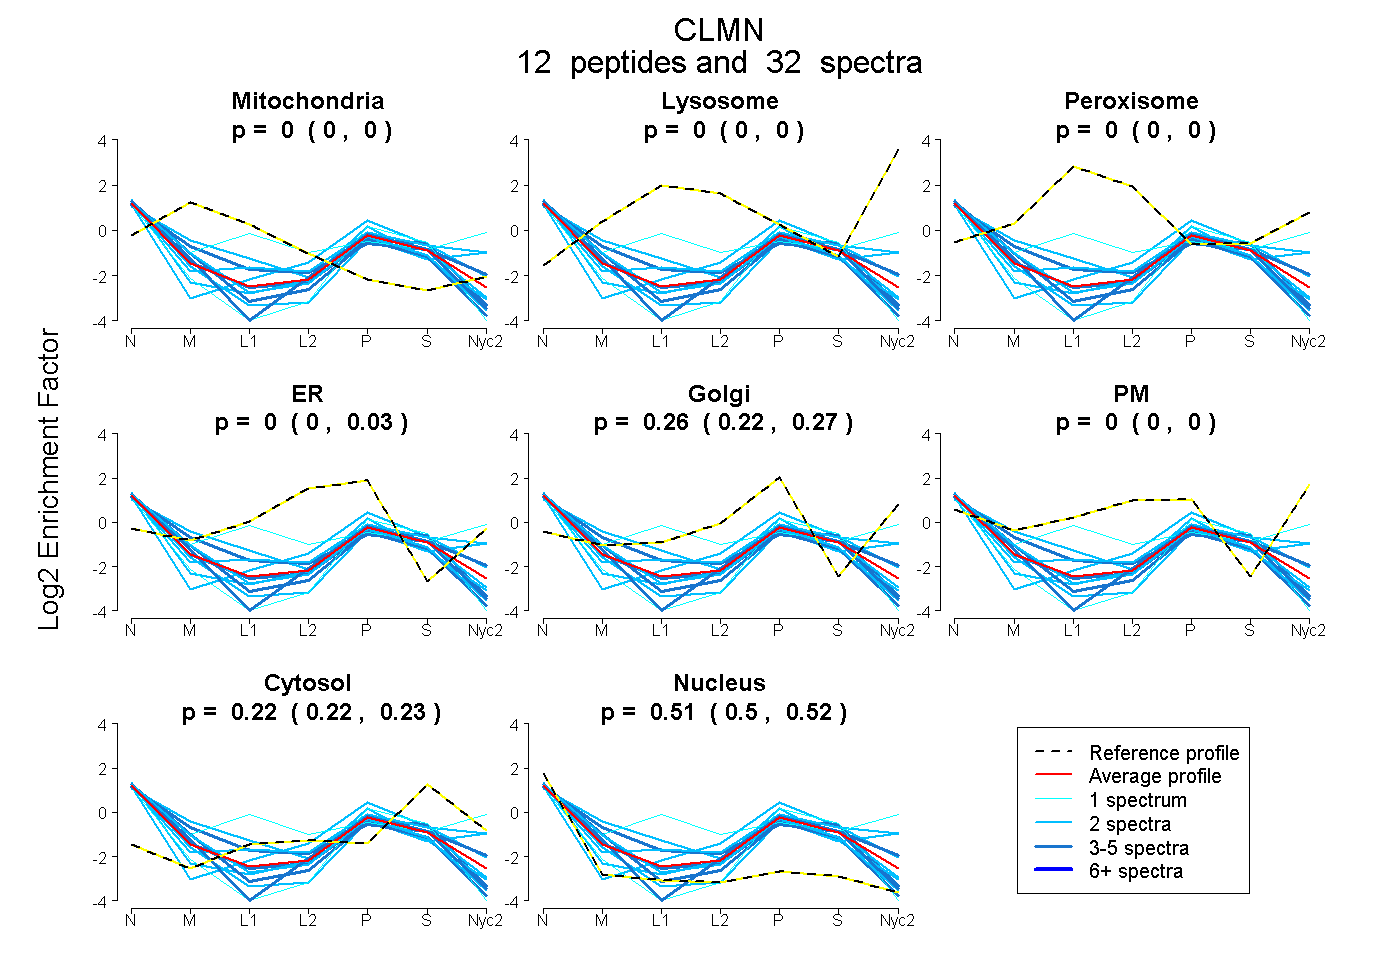 |
0.000
0.000 | 0.000 |
0.000
0.000 | 0.000 |
|
0.000
0.000 | 0.000 |
0.000
0.000 | 0.025 |
0.262
0.224 | 0.271 |
0.000
0.000 | 0.000 |
0.225
0.218 | 0.230 |
0.513
0.501 | 0.521 |
|
| | | Plot |
Mito |
|
Lyso or Perox |
|
ER |
Golgi |
PM |
Cytosol |
Nucleus |
|
| Expt B |
3
peptides |
4
spectra |
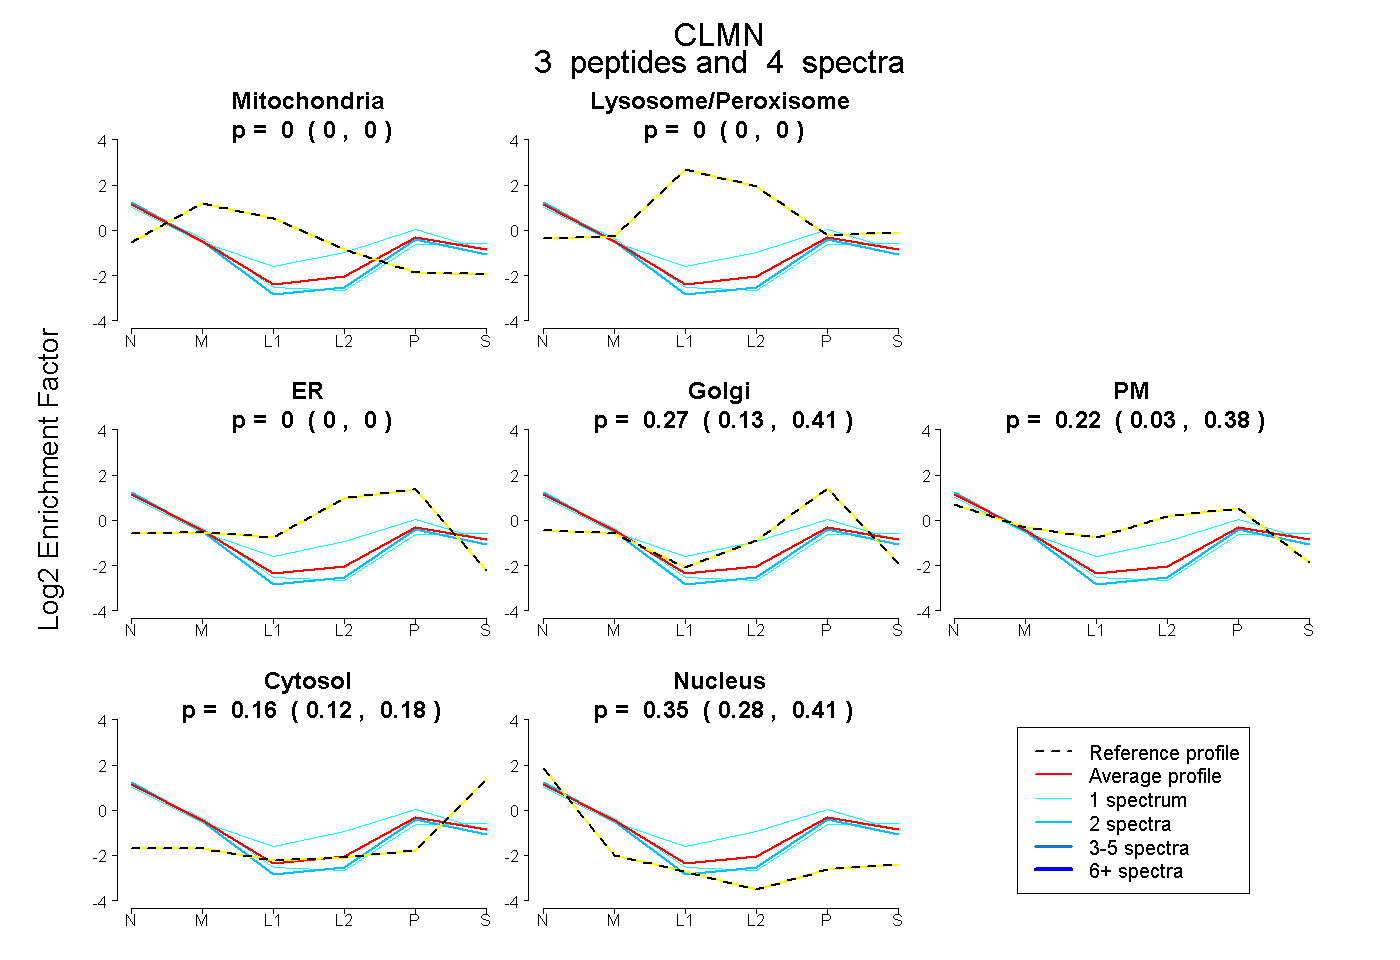 |
0.000
0.000 | 0.000 |
|
0.000
0.000 | 0.000 |
|
0.000
0.000 | 0.000 |
0.274
0.126 | 0.405 |
0.224
0.030 | 0.376 |
0.155
0.123 | 0.181 |
0.346
0.282 | 0.405 |
|
| 1 spectrum, NLLHEYK |
0.000 |
|
0.000 |
|
0.000 |
0.291 |
0.079 |
0.217 |
0.413 |
|
| 1 spectrum, VQNLQVER |
0.000 |
|
0.000 |
|
0.000 |
0.030 |
0.655 |
0.164 |
0.151 |
|
| 2 spectra, QALEDSTR |
0.000 |
|
0.000 |
|
0.000 |
0.447 |
0.000 |
0.095 |
0.459 |
|
| | | Plot |
|
Lyso |
|
|
|
|
|
|
|
Other |
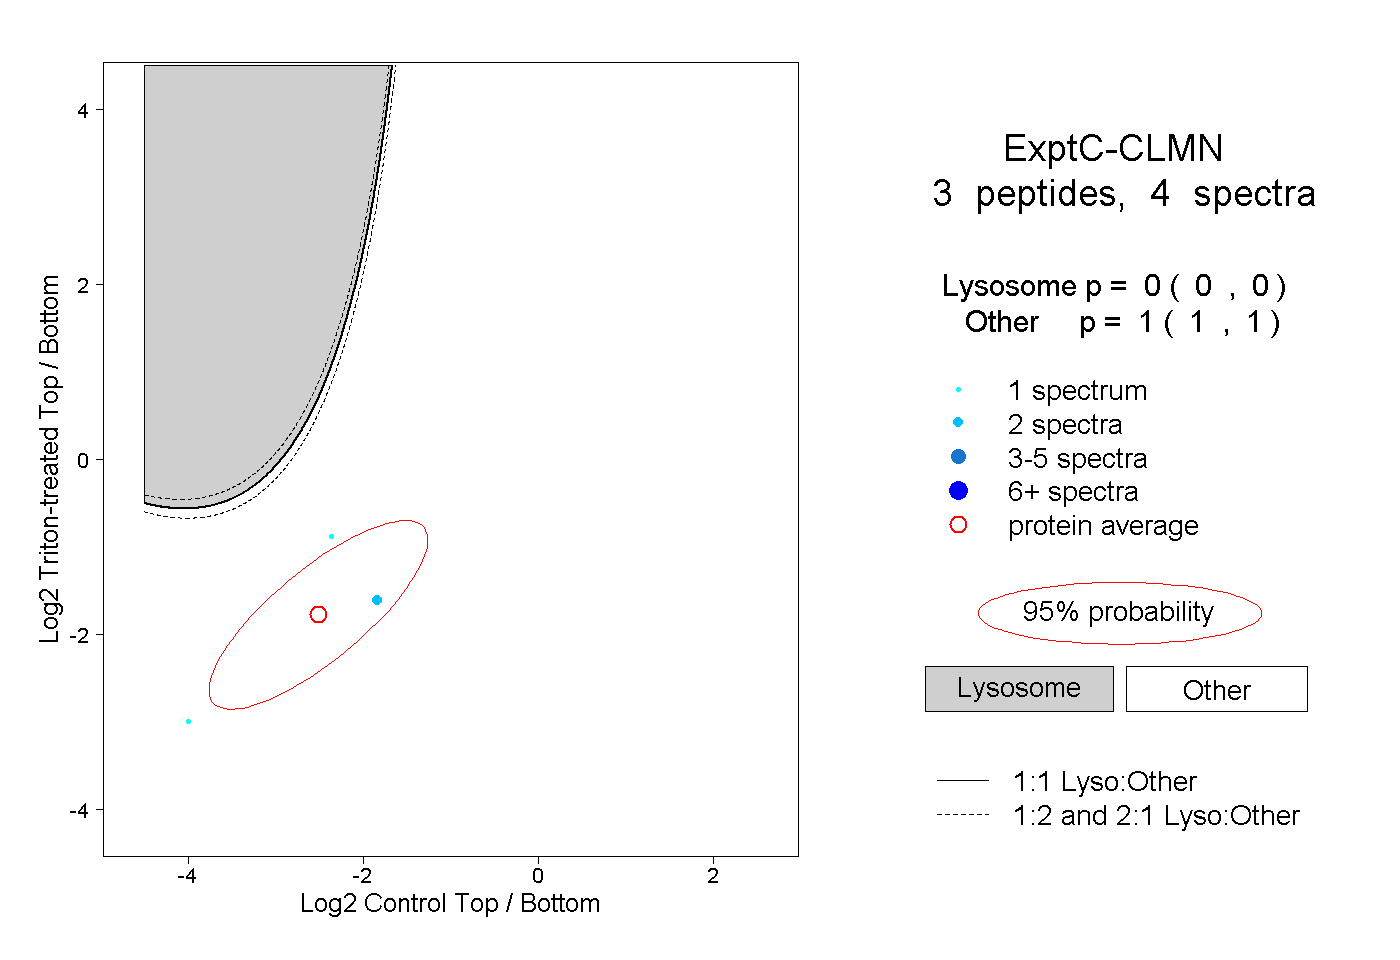
| Expt C |
3
peptides |
4
spectra |
 |
|
0.000
0.000 | 0.000 |
|
|
|
|
|
|
|
1.000
1.000 | 1.000 |