 12
12peptides
spectra
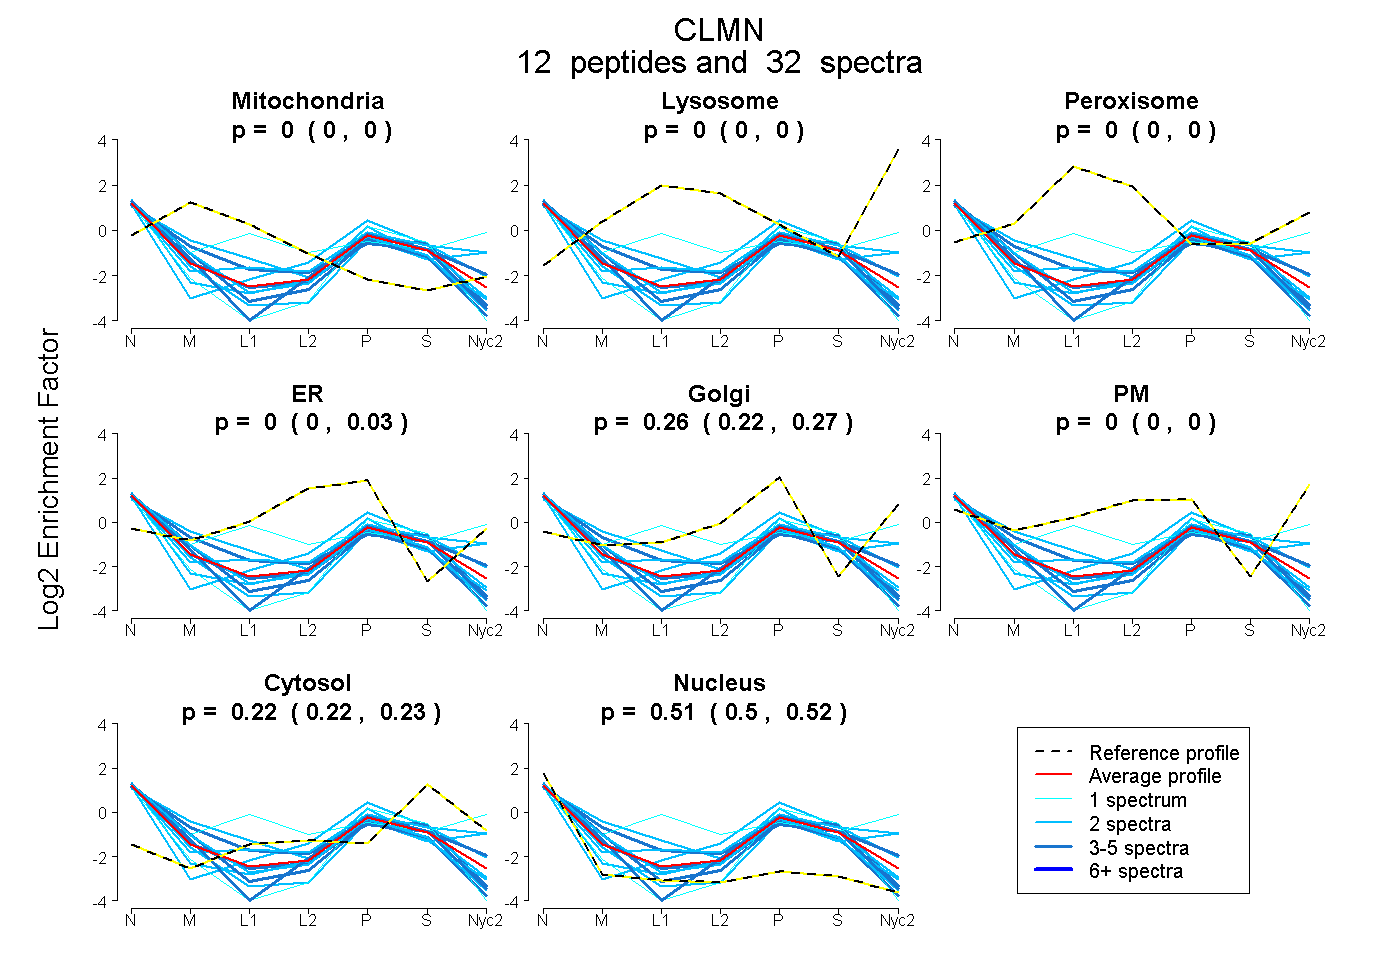
0.000 | 0.000
0.000 | 0.000
0.000 | 0.000
0.000 | 0.025
0.224 | 0.271
0.000 | 0.000
0.218 | 0.230
0.501 | 0.521
| Plot | Mito | Lyso | Perox | ER | Golgi | PM | Cytosol | Nucleus | |||||
| Expt A |
12 peptides |
32 spectra |
|
0.000 0.000 | 0.000 |
0.000 0.000 | 0.000 |
0.000 0.000 | 0.000 |
0.000 0.000 | 0.025 |
0.262 0.224 | 0.271 |
0.000 0.000 | 0.000 |
0.225 0.218 | 0.230 |
0.513 0.501 | 0.521 |
| 1 spectrum, SVAVAVK | 0.000 | 0.000 | 0.202 | 0.000 | 0.000 | 0.355 | 0.186 | 0.257 | ||
| 4 spectra, EAPIESTFVR | 0.000 | 0.000 | 0.000 | 0.149 | 0.000 | 0.000 | 0.291 | 0.561 | ||
| 2 spectra, DNTILANSVELK | 0.209 | 0.000 | 0.000 | 0.000 | 0.206 | 0.148 | 0.152 | 0.285 | ||
| 2 spectra, EELIGQISDIR | 0.000 | 0.000 | 0.000 | 0.000 | 0.141 | 0.000 | 0.210 | 0.649 | ||
| 2 spectra, GPSPPSPR | 0.000 | 0.000 | 0.000 | 0.000 | 0.202 | 0.160 | 0.302 | 0.335 | ||
| 2 spectra, KPEQEAR | 0.000 | 0.000 | 0.000 | 0.003 | 0.257 | 0.000 | 0.139 | 0.601 | ||
| 1 spectrum, SGLAFLAVIK | 0.000 | 0.000 | 0.000 | 0.000 | 0.060 | 0.000 | 0.250 | 0.690 | ||
| 5 spectra, QALEDSTR | 0.058 | 0.000 | 0.000 | 0.017 | 0.125 | 0.000 | 0.139 | 0.662 | ||
| 2 spectra, DPFYSSEFR | 0.000 | 0.000 | 0.000 | 0.066 | 0.239 | 0.000 | 0.303 | 0.391 | ||
| 4 spectra, WINLHLEK | 0.000 | 0.000 | 0.000 | 0.000 | 0.181 | 0.000 | 0.189 | 0.630 | ||
| 2 spectra, TLLSWVQR | 0.053 | 0.000 | 0.000 | 0.108 | 0.082 | 0.000 | 0.152 | 0.606 | ||
| 5 spectra, FLEDSNVK | 0.199 | 0.000 | 0.000 | 0.000 | 0.207 | 0.022 | 0.232 | 0.340 |
| Plot | Mito | Lyso or Perox | ER | Golgi | PM | Cytosol | Nucleus | ||||||
| Expt B |
3 peptides |
4 spectra |
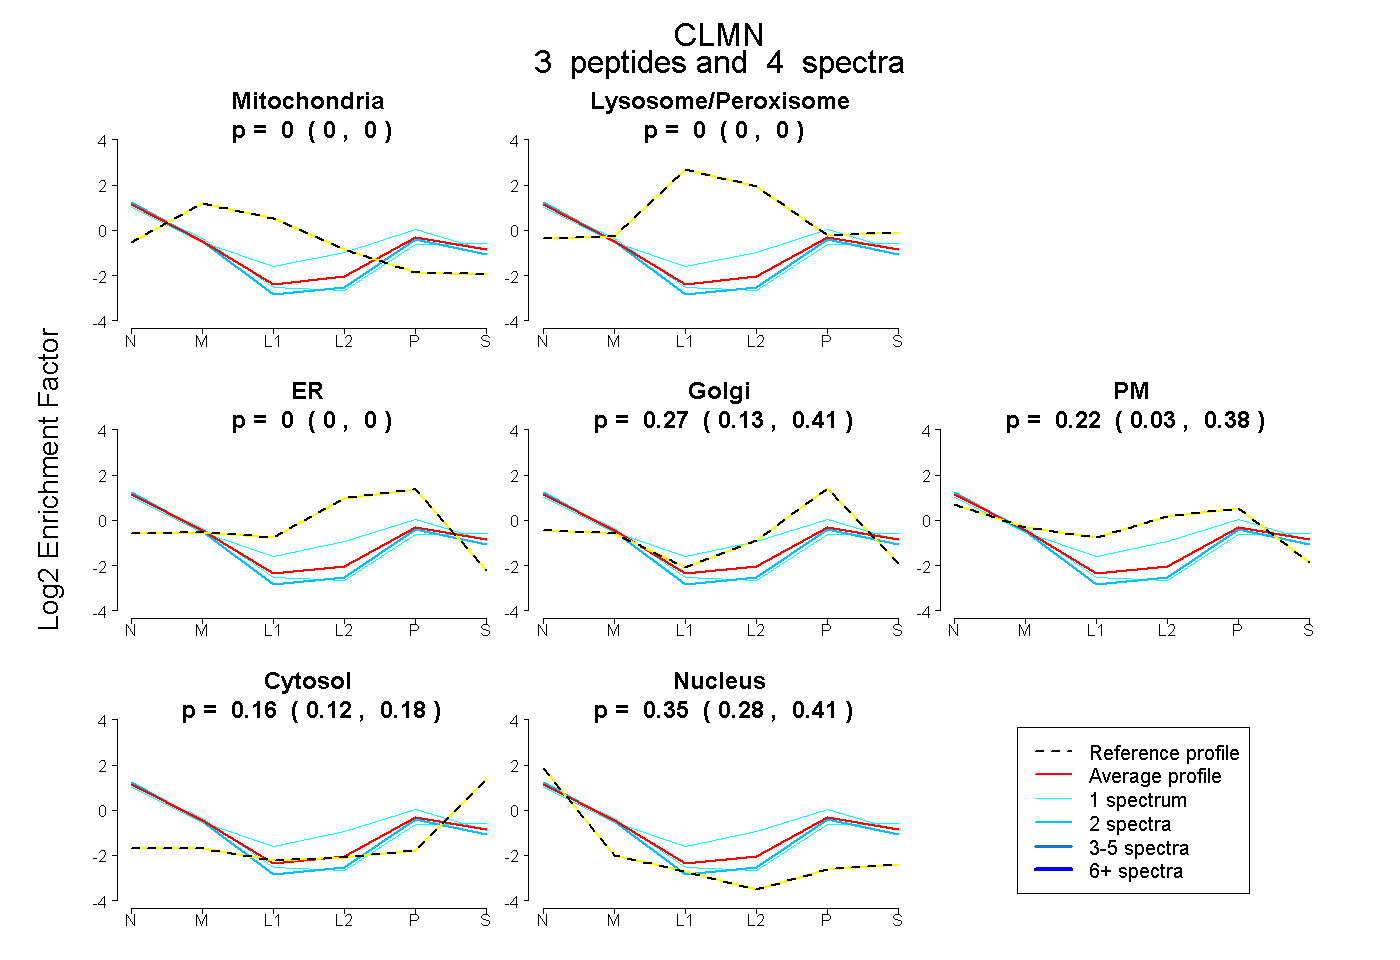 |
0.000 0.000 | 0.000 |
0.000 0.000 | 0.000 |
0.000 0.000 | 0.000 |
0.274 0.126 | 0.405 |
0.224 0.030 | 0.376 |
0.155 0.123 | 0.181 |
0.346 0.282 | 0.405 |
|||
| Plot | Lyso | Other | |||||||||||
| Expt C |
3 peptides |
4 spectra |
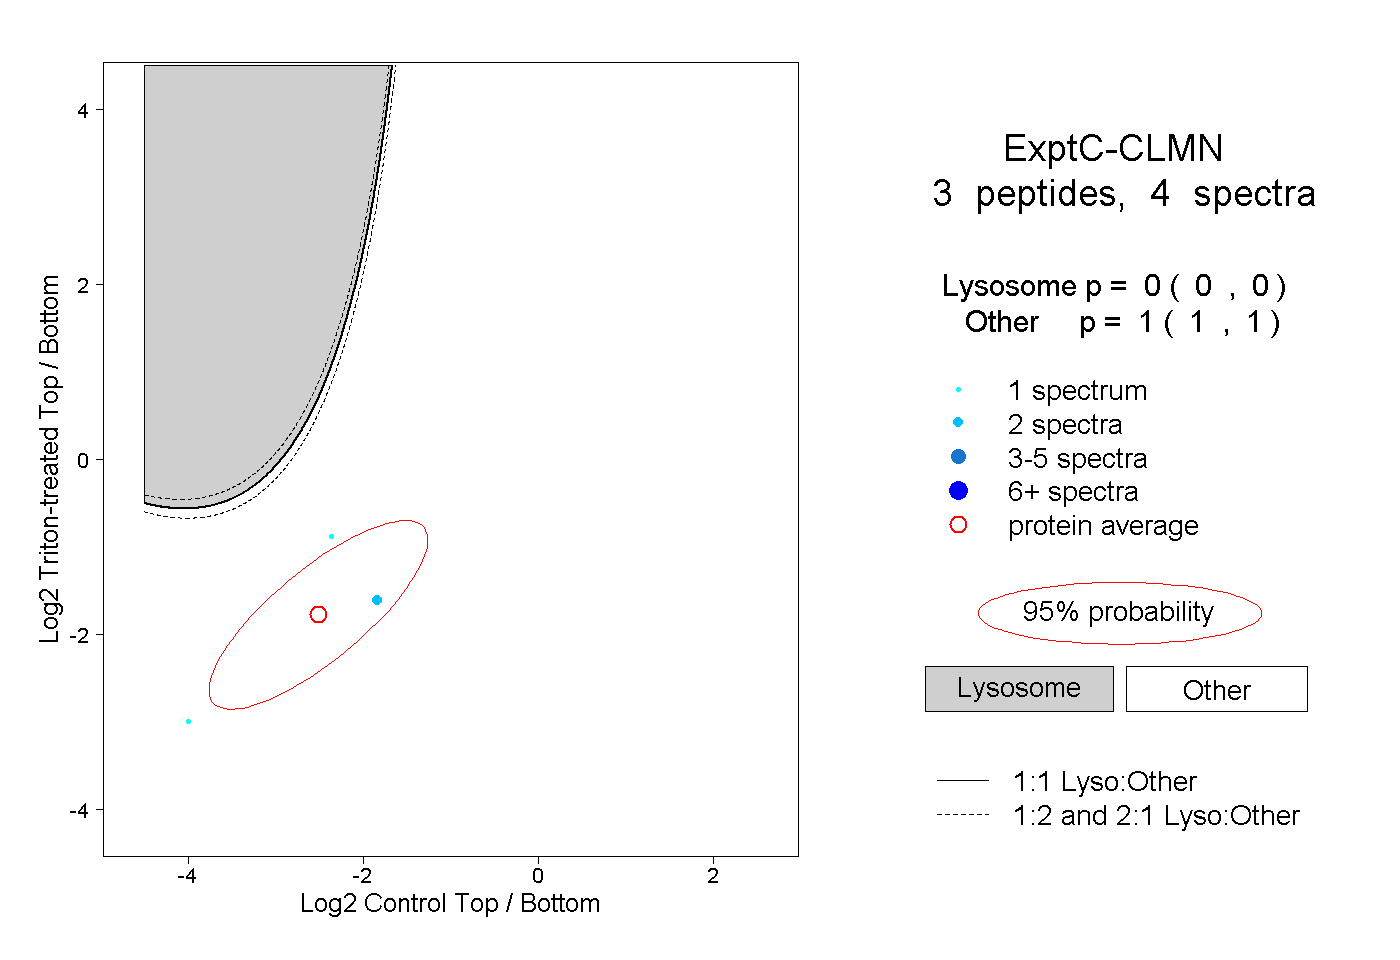 |
0.000 0.000 | 0.000 |
1.000 1.000 | 1.000 |