 21
21peptides
spectra
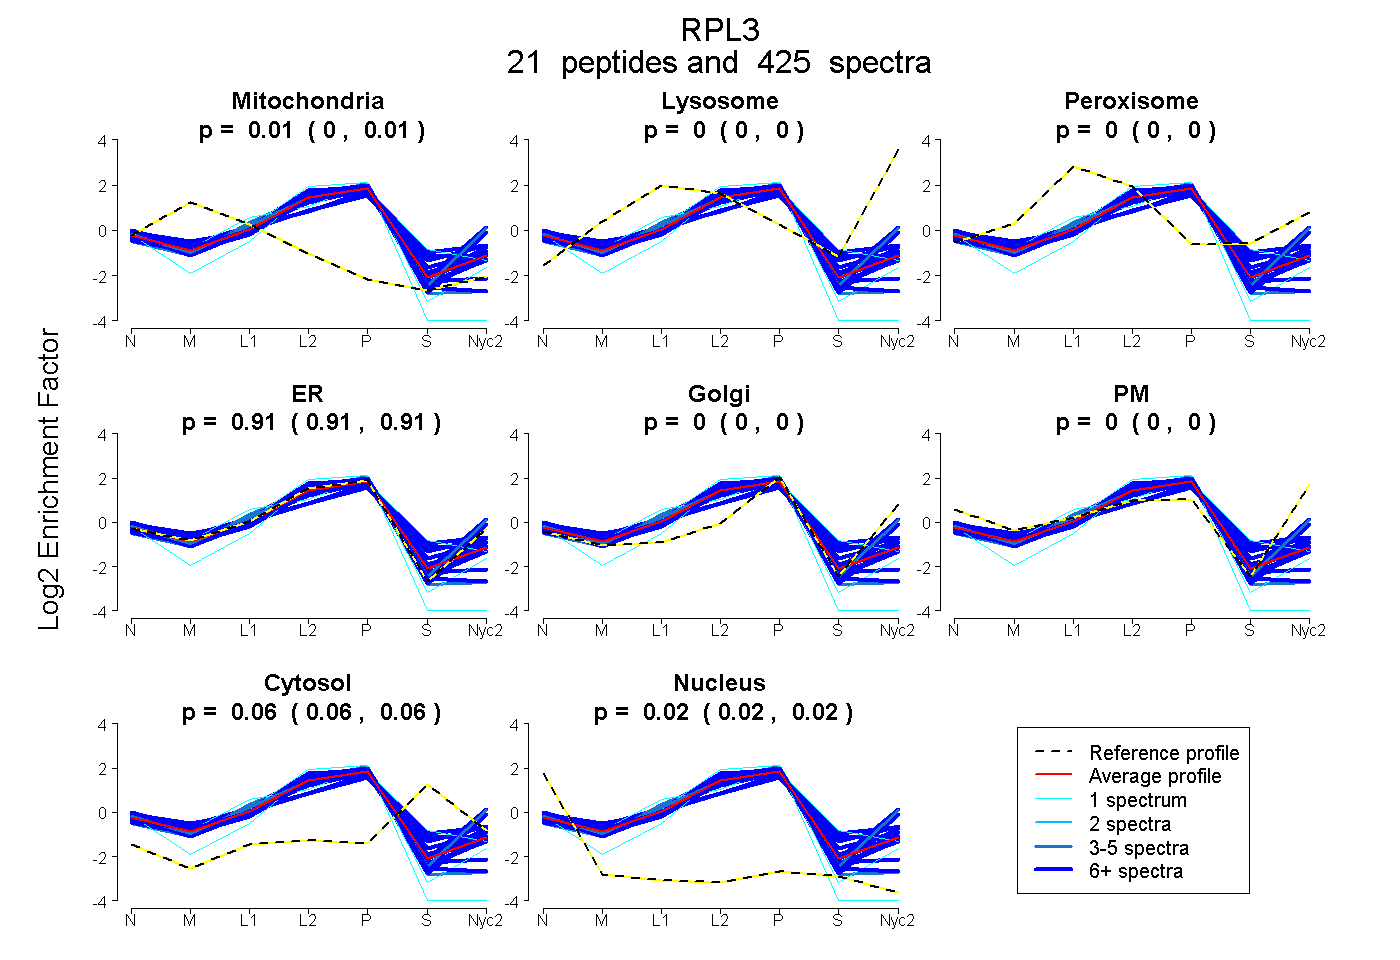
0.004 | 0.006
0.000 | 0.000
0.000 | 0.000
0.910 | 0.912
0.000 | 0.000
0.000 | 0.000
0.060 | 0.064
0.020 | 0.022
15peptides
spectra
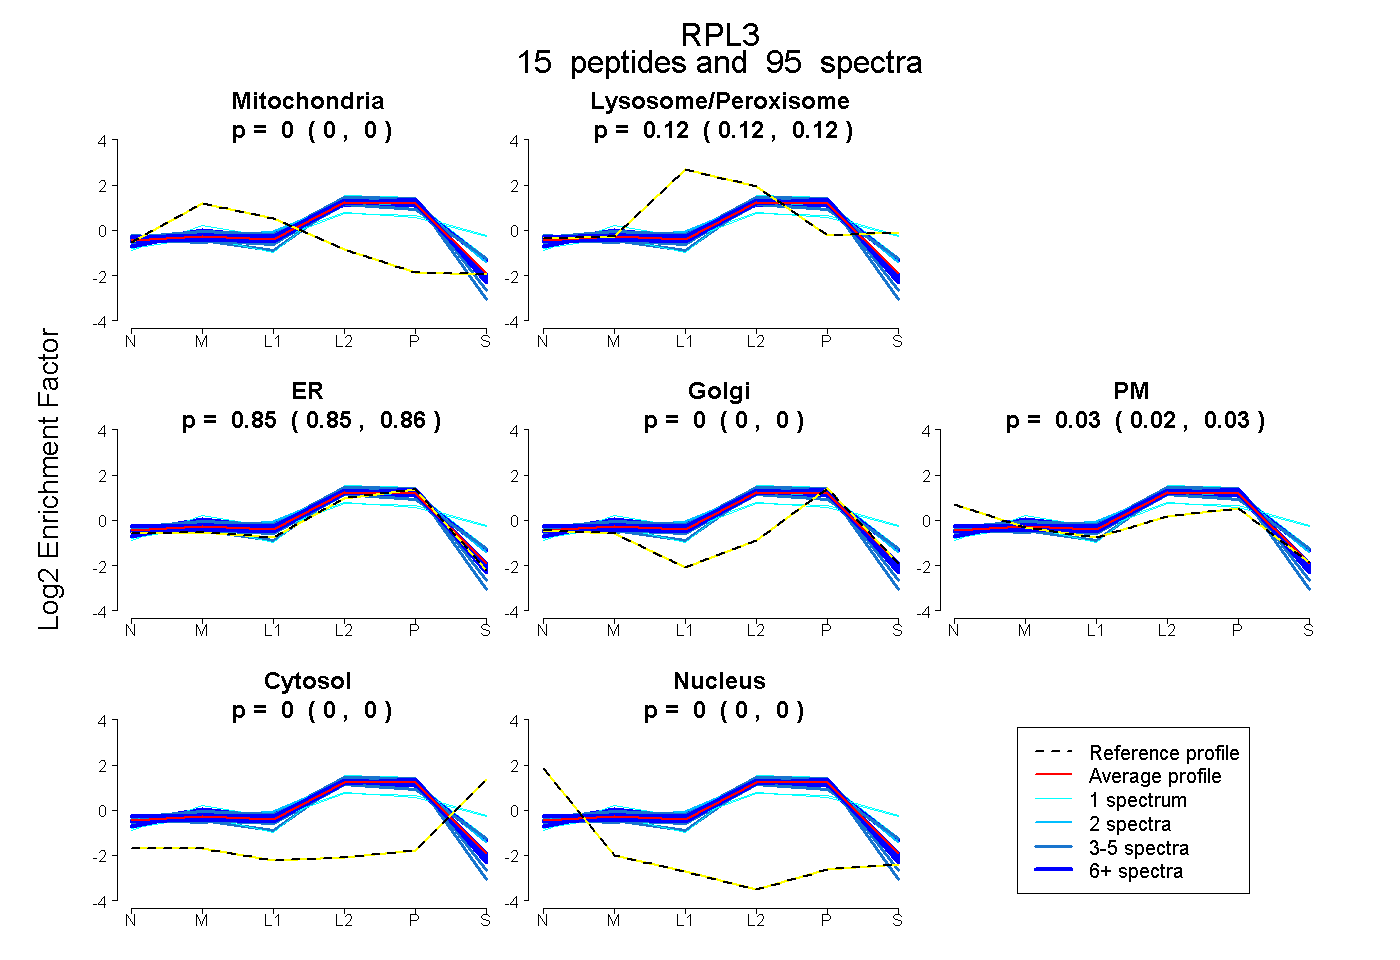
0.000 | 0.000
0.117 | 0.124
0.847 | 0.859
0.000 | 0.000
0.021 | 0.030
0.000 | 0.000
0.000 | 0.000
17peptides
spectra
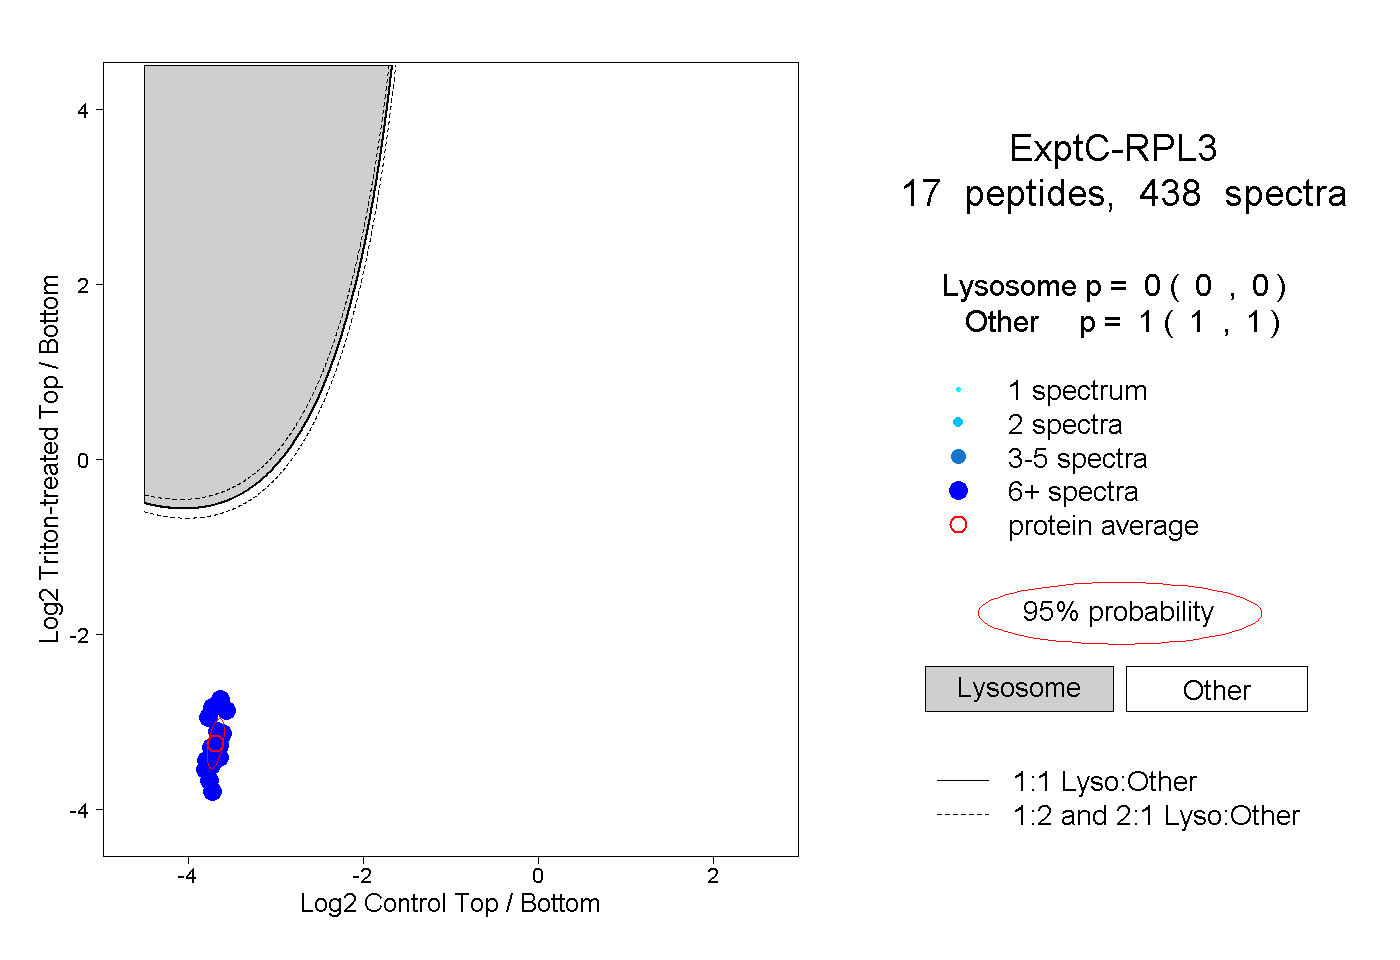
0.000 | 0.000
1.000 | 1.000
15peptides
spectra
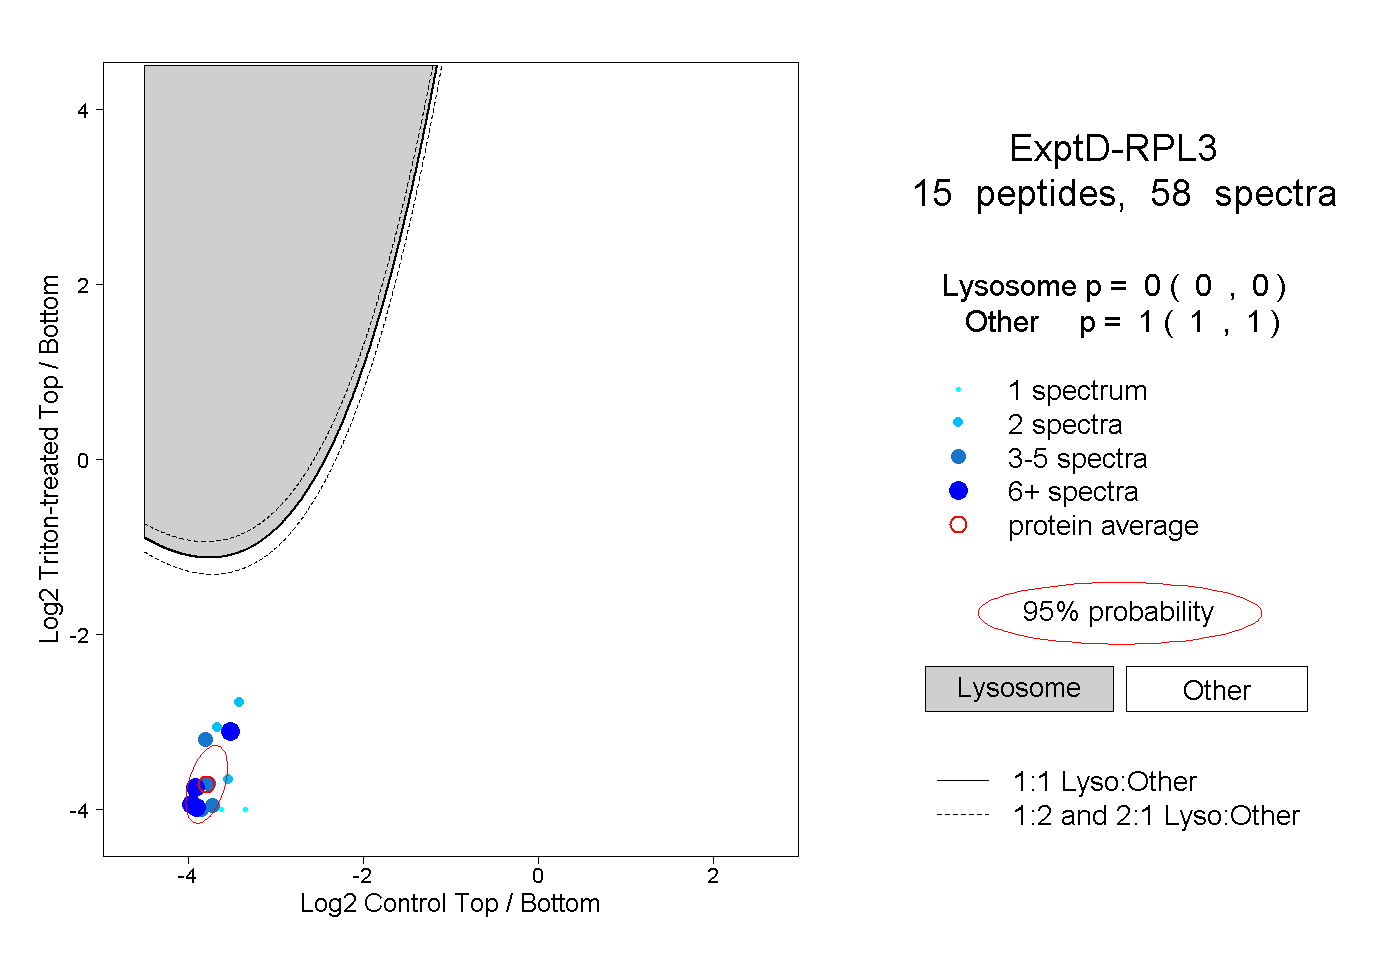
0.000 | 0.000
1.000 | 1.000