RPL3
[ENSRNOP00000060662]
Main page
| | | Plot |
Mito |
Lyso |
|
Perox |
ER |
Golgi |
PM |
Cytosol |
Nucleus |
|
| Expt A |
 21
21
peptides |
425
spectra |
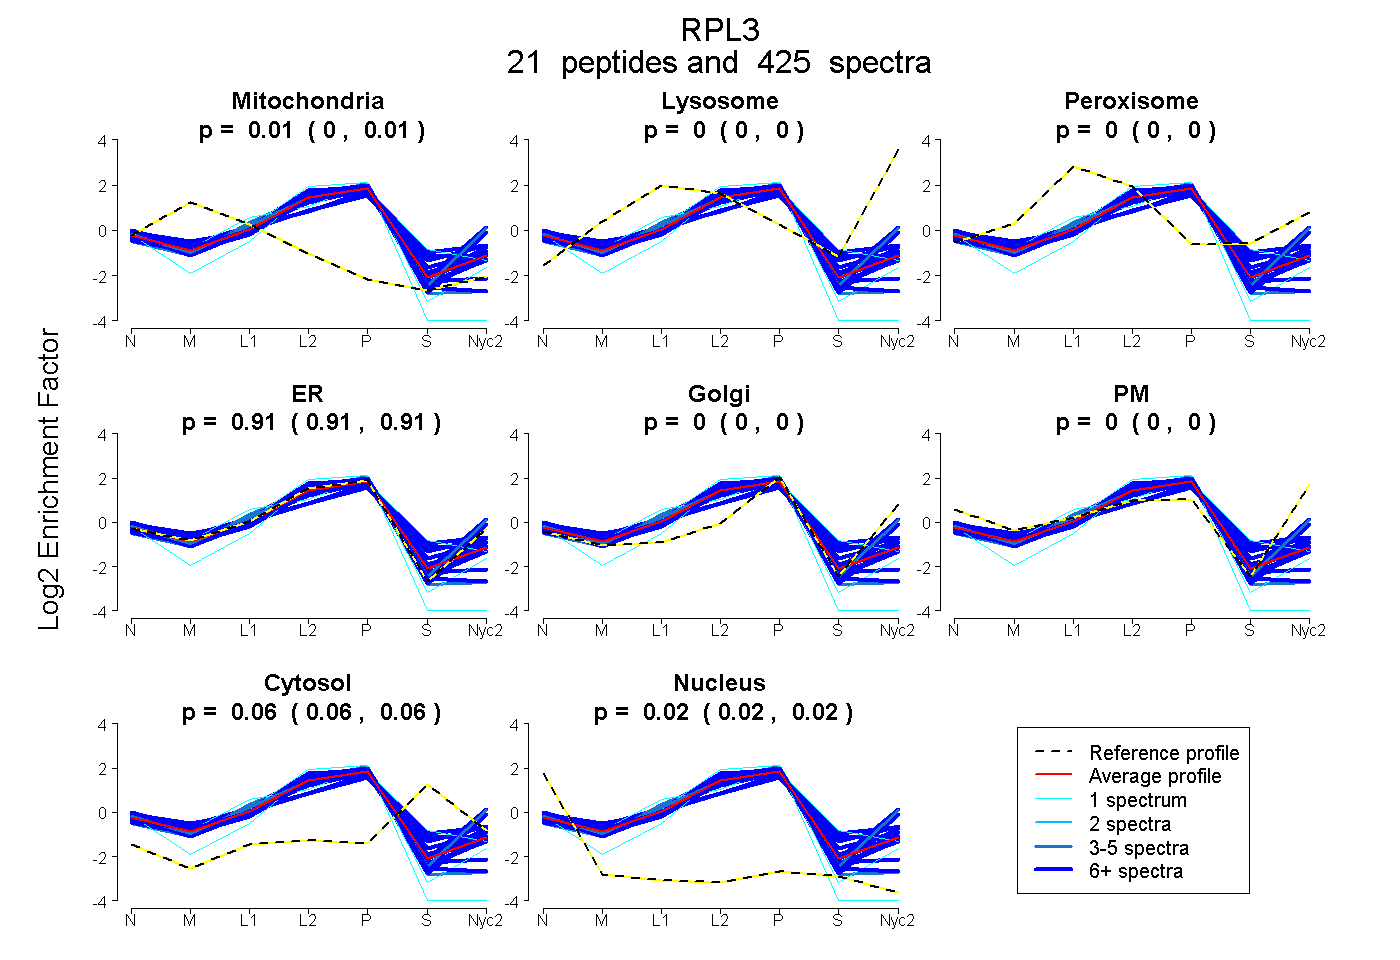 |
0.005
0.004 | 0.006 |
0.000
0.000 | 0.000 |
|
0.000
0.000 | 0.000 |
0.911
0.910 | 0.912 |
0.000
0.000 | 0.000 |
0.000
0.000 | 0.000 |
0.062
0.060 | 0.064 |
0.021
0.020 | 0.022 |
|
| | | Plot |
Mito |
|
Lyso or Perox |
|
ER |
Golgi |
PM |
Cytosol |
Nucleus |
|
| Expt B |
15
peptides |
95
spectra |
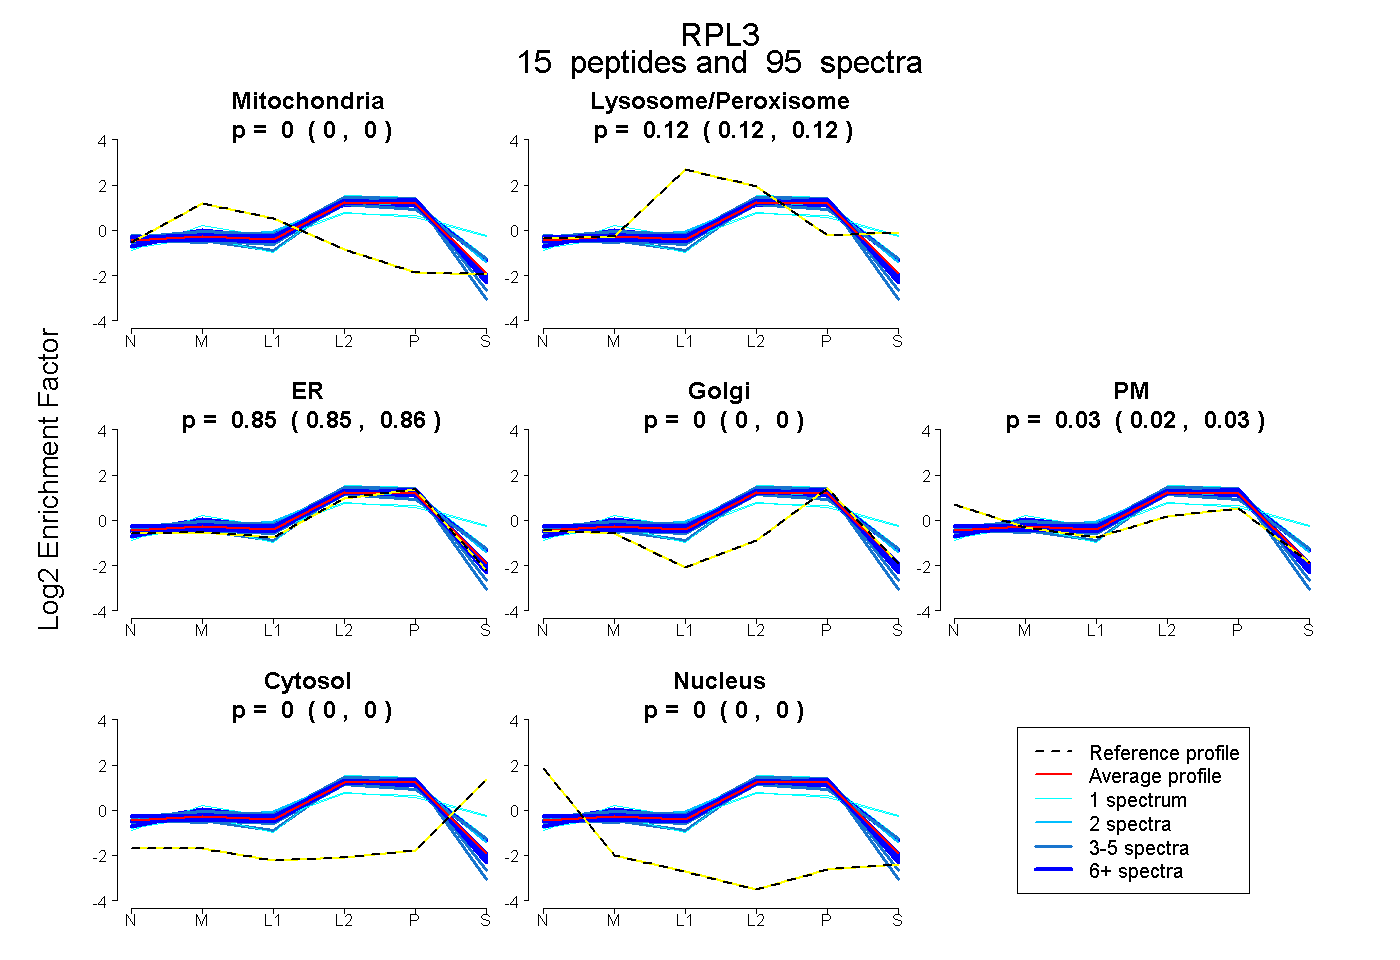 |
0.000
0.000 | 0.000 |
|
0.121
0.117 | 0.124 |
|
0.853
0.847 | 0.859 |
0.000
0.000 | 0.000 |
0.026
0.021 | 0.030 |
0.000
0.000 | 0.000 |
0.000
0.000 | 0.000 |
|
| | | Plot |
|
Lyso |
|
|
|
|
|
|
|
Other |
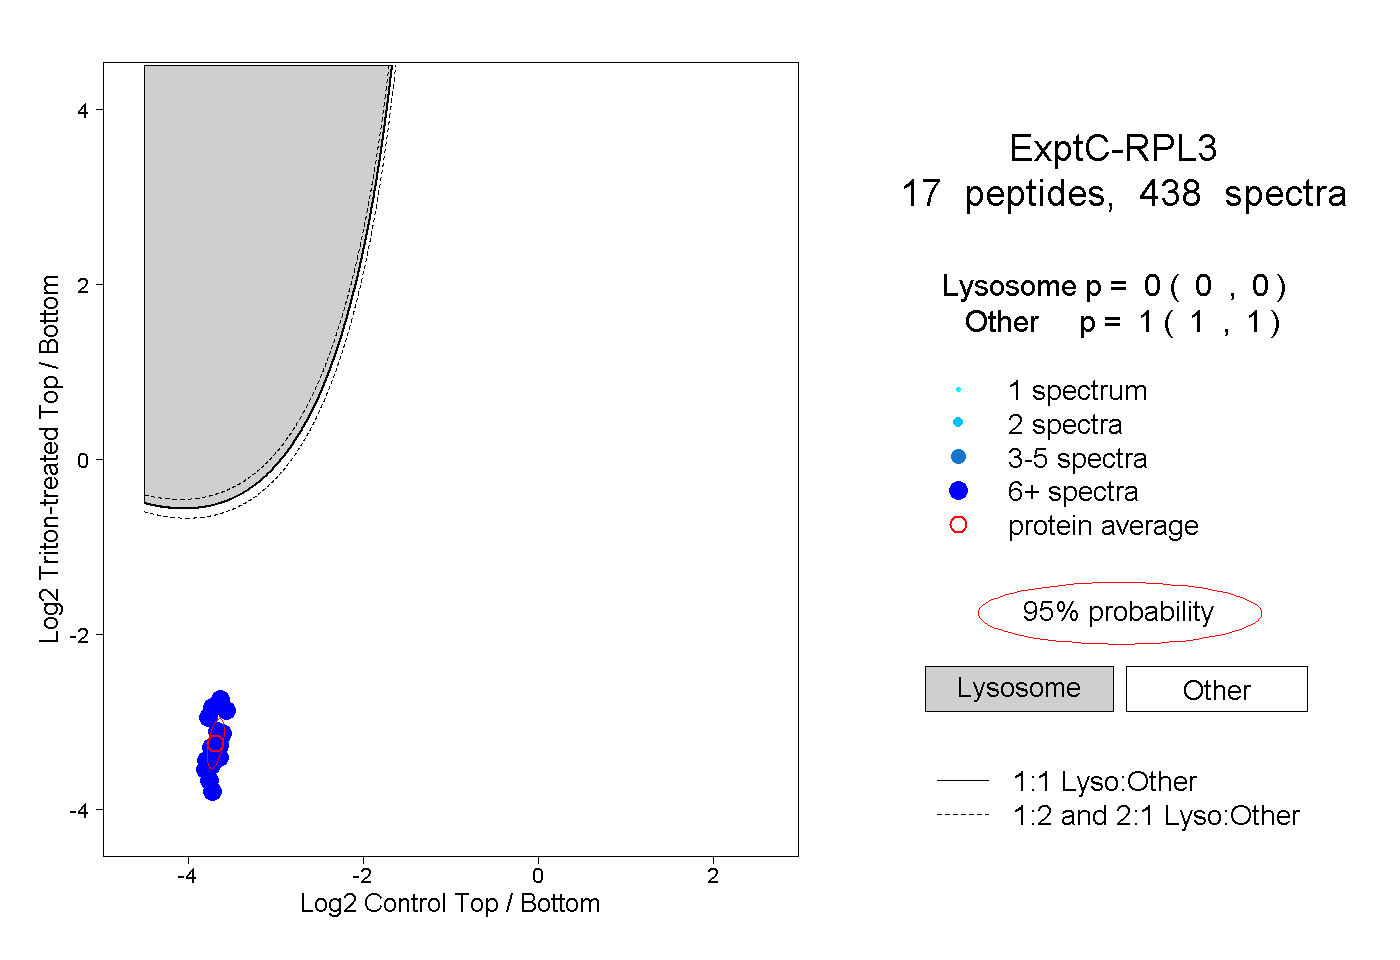
| Expt C |
17
peptides |
438
spectra |
 |
|
0.000
0.000 | 0.000 |
|
|
|
|
|
|
|
1.000
1.000 | 1.000 |
| | | Plot |
|
Lyso |
|
|
|
|
|
|
|
Other |
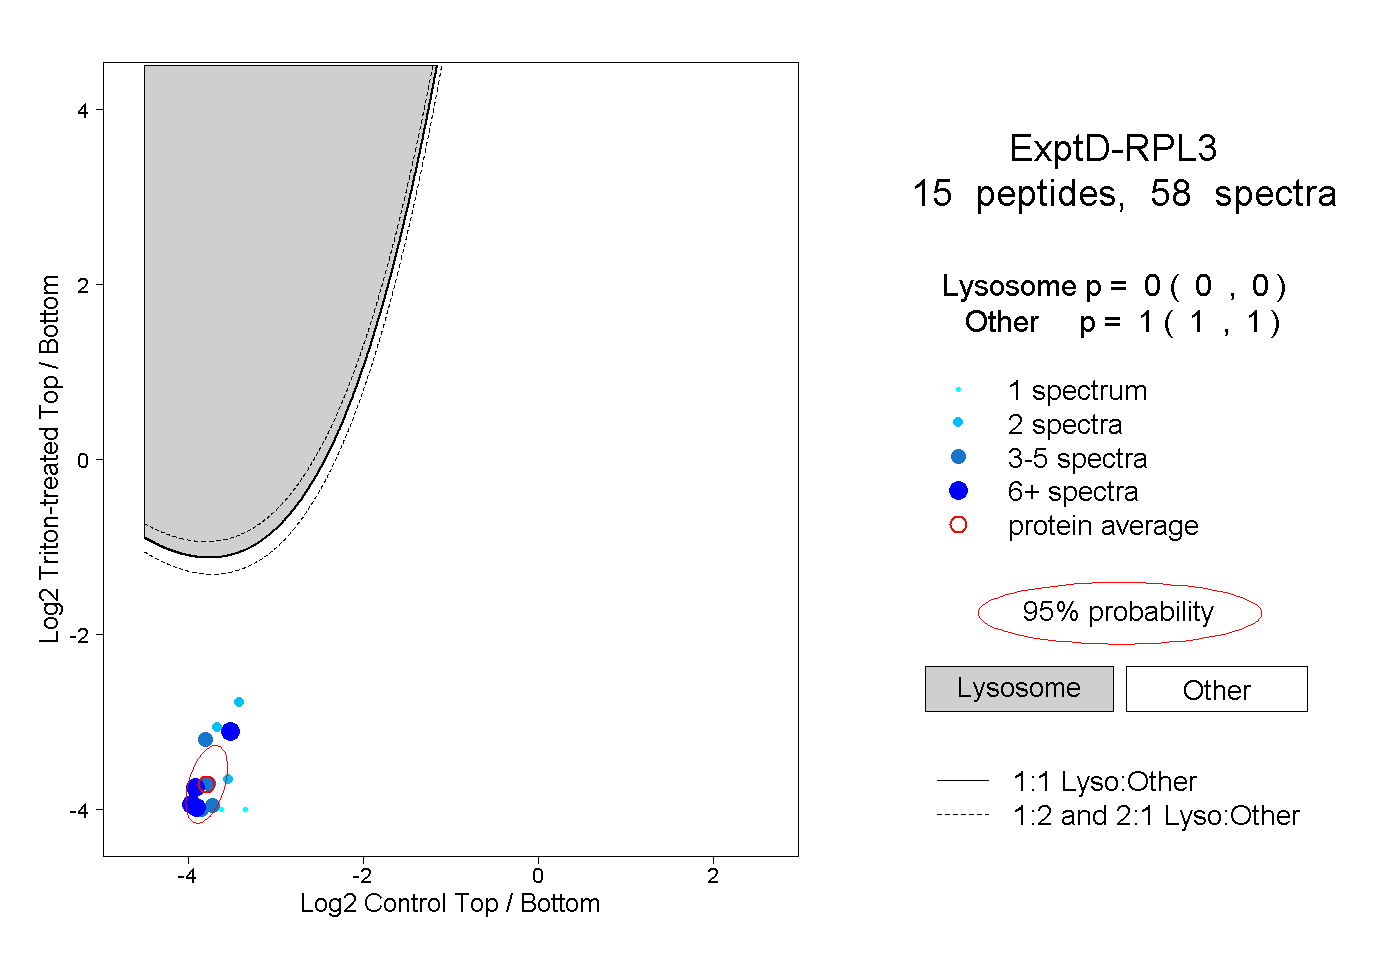
| Expt D |
15
peptides |
58
spectra |
 |
|
0.000
0.000 | 0.000 |
|
|
|
|
|
|
|
1.000
1.000 | 1.000 |
| 1 spectrum, VAFSAVR |
|
0.000 |
|
|
|
|
|
|
|
1.000 |
| 1 spectrum, FQTMEEK |
|
0.000 |
|
|
|
|
|
|
|
1.000 |
| 10 spectra, VAFSVAR |
|
0.000 |
|
|
|
|
|
|
|
1.000 |
| 2 spectra, VACIGAWHPAR |
|
0.000 |
|
|
|
|
|
|
|
1.000 |
| 1 spectrum, NNASTDYDLSDK |
|
0.000 |
|
|
|
|
|
|
|
1.000 |
| 2 spectra, TVFAEHISDECK |
|
0.000 |
|
|
|
|
|
|
|
1.000 |
| 3 spectra, HGSLGFLPR |
|
0.000 |
|
|
|
|
|
|
|
1.000 |
| 5 spectra, FIDTTSK |
|
0.000 |
|
|
|
|
|
|
|
1.000 |
| 6 spectra, AGMTHIVR |
|
0.000 |
|
|
|
|
|
|
|
1.000 |
| 8 spectra, YCQVIR |
|
0.000 |
|
|
|
|
|
|
|
1.000 |
| 5 spectra, SLLVQTK |
|
0.000 |
|
|
|
|
|
|
|
1.000 |
| 3 spectra, IGQGYLIK |
|
0.000 |
|
|
|
|
|
|
|
1.000 |
| 8 spectra, EVDRPGSK |
|
0.000 |
|
|
|
|
|
|
|
1.000 |
| 1 spectrum, GCVVGTK |
|
0.000 |
|
|
|
|
|
|
|
1.000 |
| 2 spectra, IIAHTQMR |
|
0.000 |
|
|
|
|
|
|
|
1.000 |