 21
21peptides
spectra
0.004 | 0.006
0.000 | 0.000
0.000 | 0.000
0.910 | 0.912
0.000 | 0.000
0.000 | 0.000
0.060 | 0.064
0.020 | 0.022
| Plot | Mito | Lyso | Perox | ER | Golgi | PM | Cytosol | Nucleus | |||||
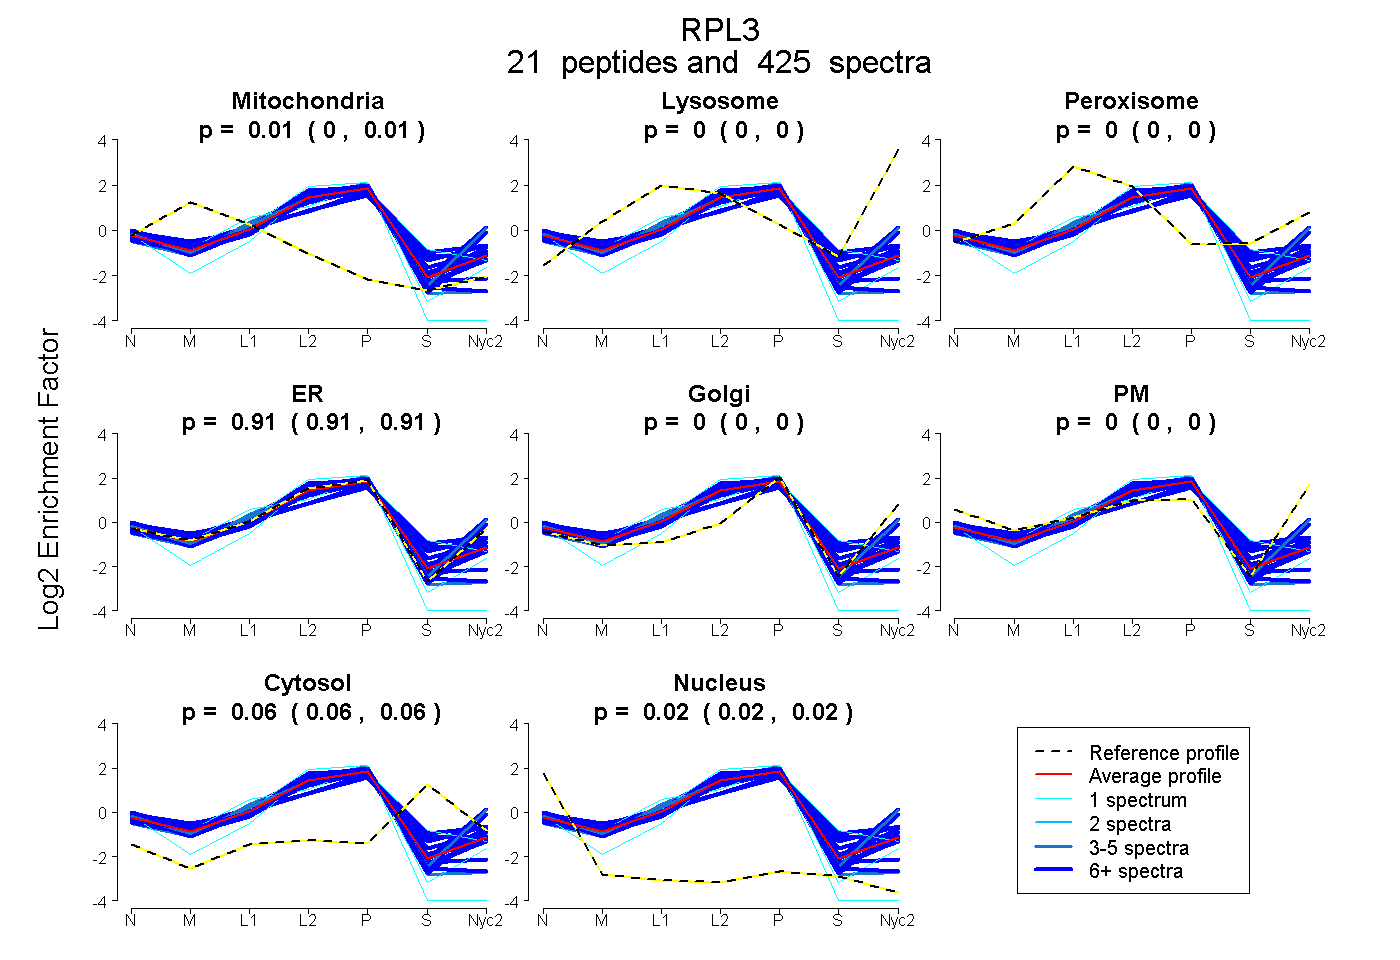
| Expt A |
21 peptides |
425 spectra |
|
0.005 0.004 | 0.006 |
0.000 0.000 | 0.000 |
0.000 0.000 | 0.000 |
0.911 0.910 | 0.912 |
0.000 0.000 | 0.000 |
0.000 0.000 | 0.000 |
0.062 0.060 | 0.064 |
0.021 0.020 | 0.022 |
| 1 spectrum, VAFSAVR | 0.000 | 0.000 | 0.000 | 0.755 | 0.000 | 0.000 | 0.245 | 0.000 | ||
| 24 spectra, FQTMEEK | 0.000 | 0.000 | 0.005 | 0.926 | 0.000 | 0.000 | 0.069 | 0.000 | ||
| 22 spectra, VACIGAWHPAR | 0.000 | 0.000 | 0.042 | 0.751 | 0.000 | 0.000 | 0.206 | 0.000 | ||
| 1 spectrum, SINPLGGFVHYGEVTNDFIMLK | 0.082 | 0.000 | 0.000 | 0.771 | 0.000 | 0.000 | 0.000 | 0.147 | ||
| 33 spectra, NNASTDYDLSDK | 0.000 | 0.000 | 0.000 | 0.860 | 0.000 | 0.000 | 0.140 | 0.000 | ||
| 8 spectra, TVFAEHISDECK | 0.002 | 0.000 | 0.046 | 0.734 | 0.000 | 0.000 | 0.208 | 0.010 | ||
| 4 spectra, AHLMEIQVNGGTVAEK | 0.009 | 0.000 | 0.000 | 0.898 | 0.000 | 0.000 | 0.000 | 0.093 | ||
| 31 spectra, HGSLGFLPR | 0.000 | 0.000 | 0.048 | 0.764 | 0.000 | 0.000 | 0.188 | 0.000 | ||
| 93 spectra, AGMTHIVR | 0.000 | 0.000 | 0.003 | 0.922 | 0.000 | 0.000 | 0.054 | 0.021 | ||
| 13 spectra, DFNSMK | 0.000 | 0.000 | 0.000 | 0.968 | 0.000 | 0.000 | 0.000 | 0.032 | ||
| 12 spectra, YCQVIR | 0.037 | 0.000 | 0.000 | 0.863 | 0.000 | 0.000 | 0.000 | 0.099 | ||
| 14 spectra, SLLVQTK | 0.000 | 0.000 | 0.000 | 0.903 | 0.000 | 0.000 | 0.093 | 0.004 | ||
| 11 spectra, EVDRPGSK | 0.077 | 0.000 | 0.000 | 0.889 | 0.000 | 0.000 | 0.000 | 0.034 | ||
| 33 spectra, VAFSVAR | 0.000 | 0.000 | 0.000 | 0.958 | 0.000 | 0.000 | 0.000 | 0.042 | ||
| 8 spectra, AFMGPLK | 0.000 | 0.016 | 0.041 | 0.903 | 0.000 | 0.041 | 0.000 | 0.000 | ||
| 11 spectra, FIDTTSK | 0.000 | 0.000 | 0.000 | 0.956 | 0.000 | 0.000 | 0.000 | 0.044 | ||
| 5 spectra, WQDDTGK | 0.000 | 0.022 | 0.018 | 0.830 | 0.089 | 0.042 | 0.000 | 0.000 | ||
| 6 spectra, IGQGYLIK | 0.000 | 0.078 | 0.007 | 0.886 | 0.000 | 0.016 | 0.013 | 0.000 | ||
| 1 spectrum, ILRPLQK | 0.000 | 0.000 | 0.000 | 0.974 | 0.000 | 0.000 | 0.000 | 0.026 | ||
| 10 spectra, GCVVGTK | 0.065 | 0.000 | 0.000 | 0.848 | 0.000 | 0.000 | 0.000 | 0.088 | ||
| 84 spectra, IIAHTQMR | 0.012 | 0.000 | 0.000 | 0.899 | 0.000 | 0.000 | 0.088 | 0.000 |
| Plot | Mito | Lyso or Perox | ER | Golgi | PM | Cytosol | Nucleus | ||||||
| Expt B |
15 peptides |
95 spectra |
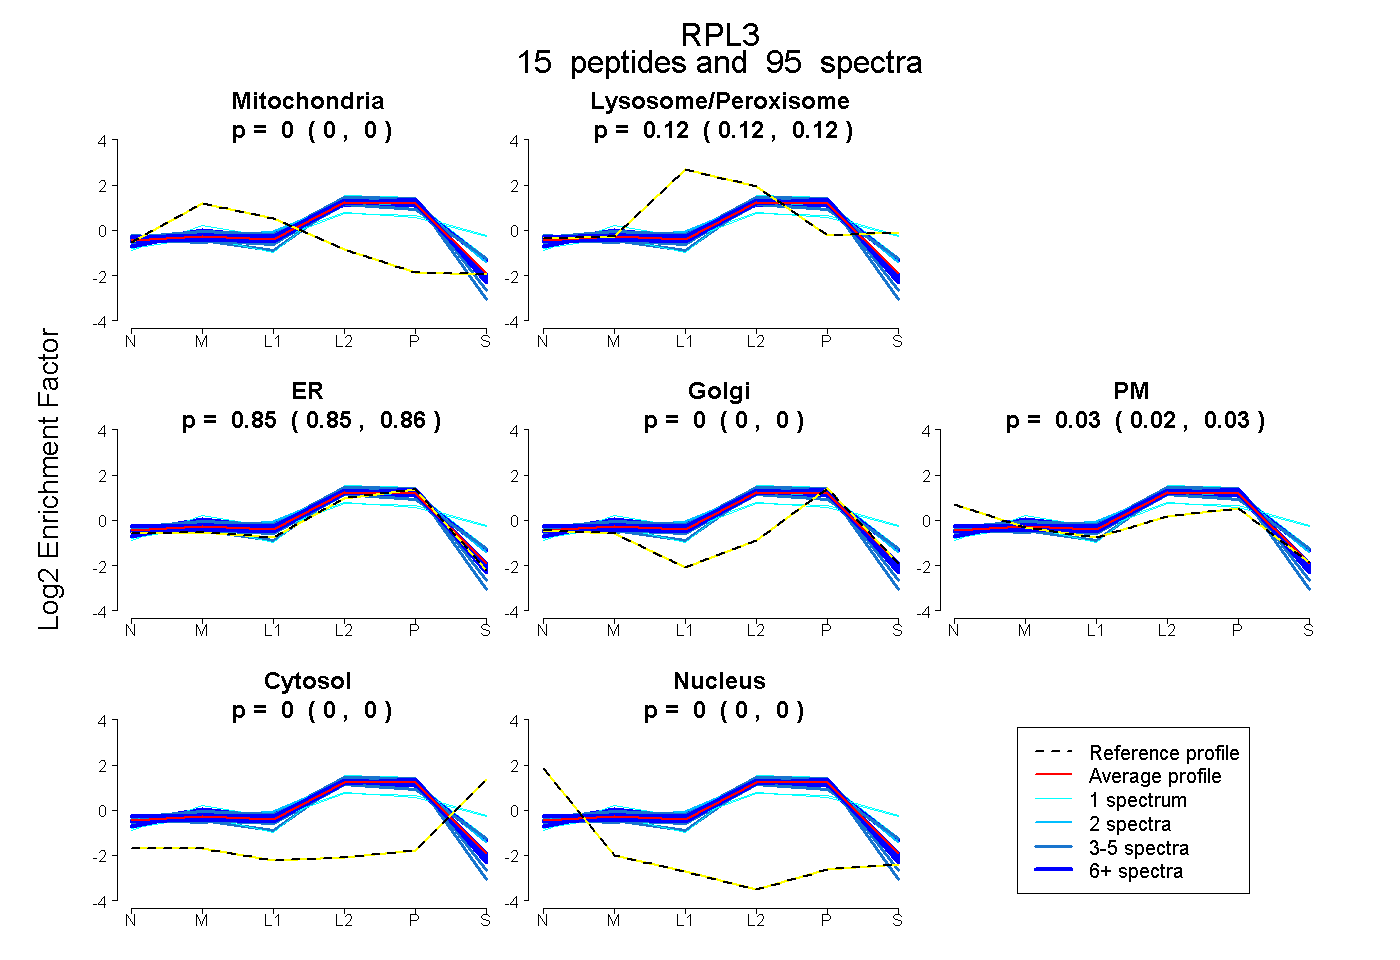 |
0.000 0.000 | 0.000 |
0.121 0.117 | 0.124 |
0.853 0.847 | 0.859 |
0.000 0.000 | 0.000 |
0.026 0.021 | 0.030 |
0.000 0.000 | 0.000 |
0.000 0.000 | 0.000 |
|||
| Plot | Lyso | Other | |||||||||||
| Expt C |
17 peptides |
438 spectra |
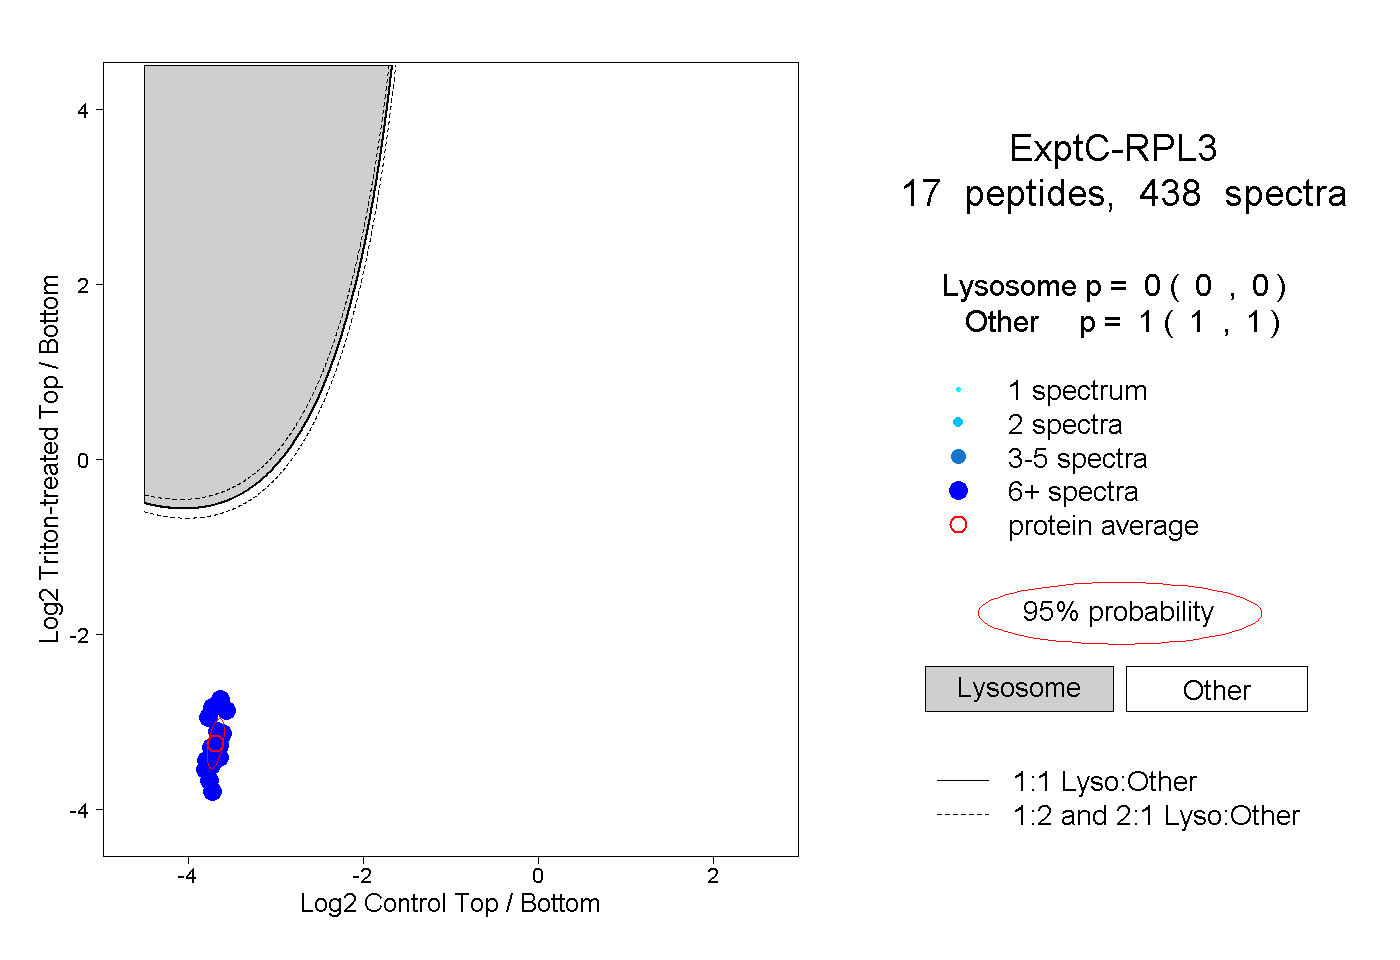 |
0.000 0.000 | 0.000 |
1.000 1.000 | 1.000 |
||||||||
| Plot | Lyso | Other | |||||||||||
| Expt D |
15 peptides |
58 spectra |
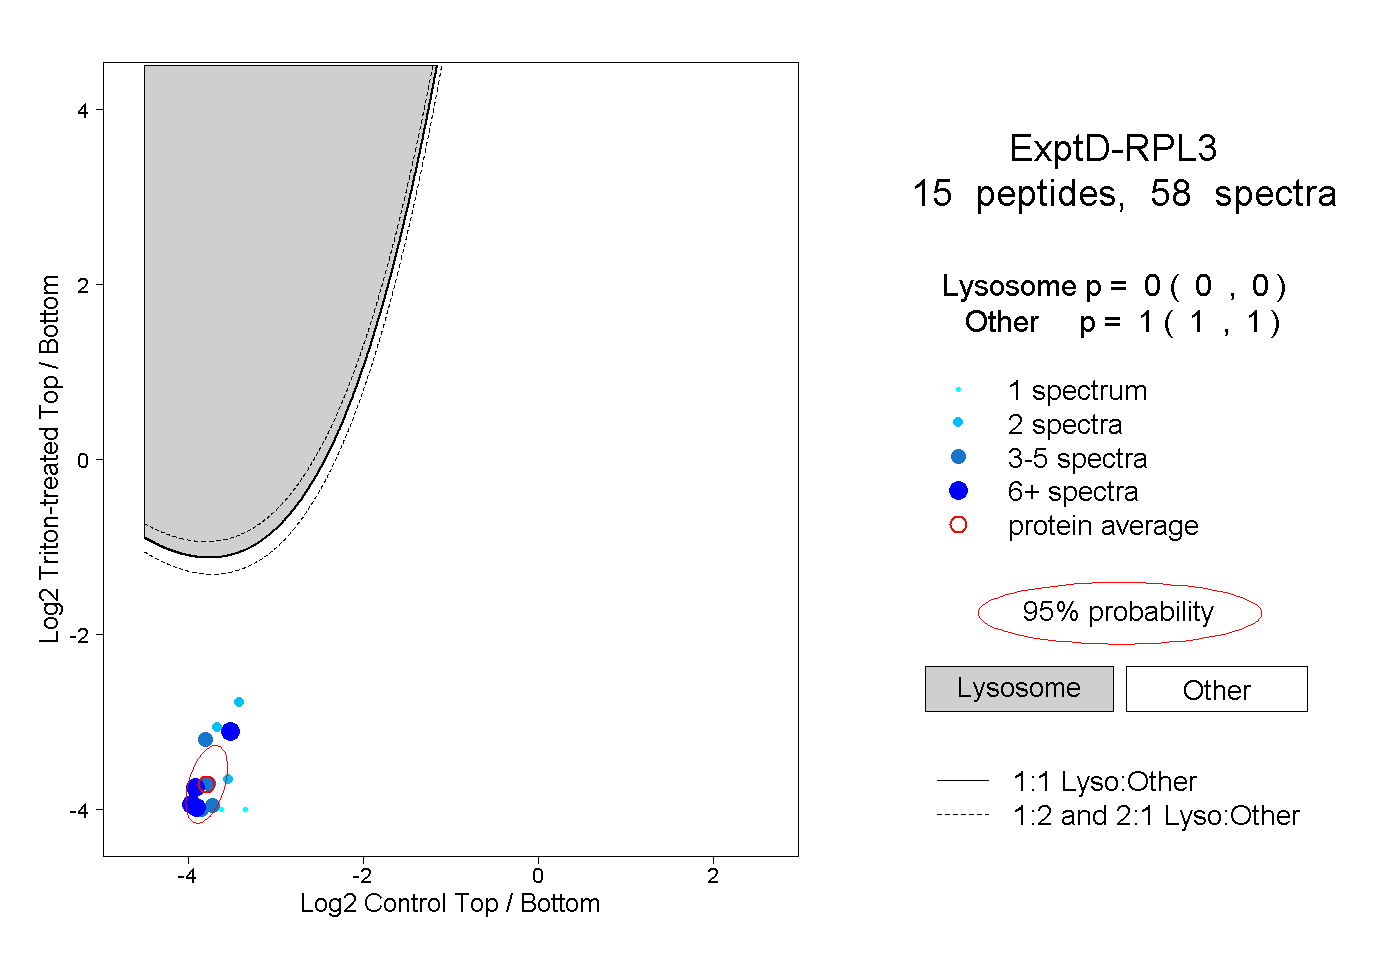 |
0.000 0.000 | 0.000 |
1.000 1.000 | 1.000 |