 10
10peptides
spectra
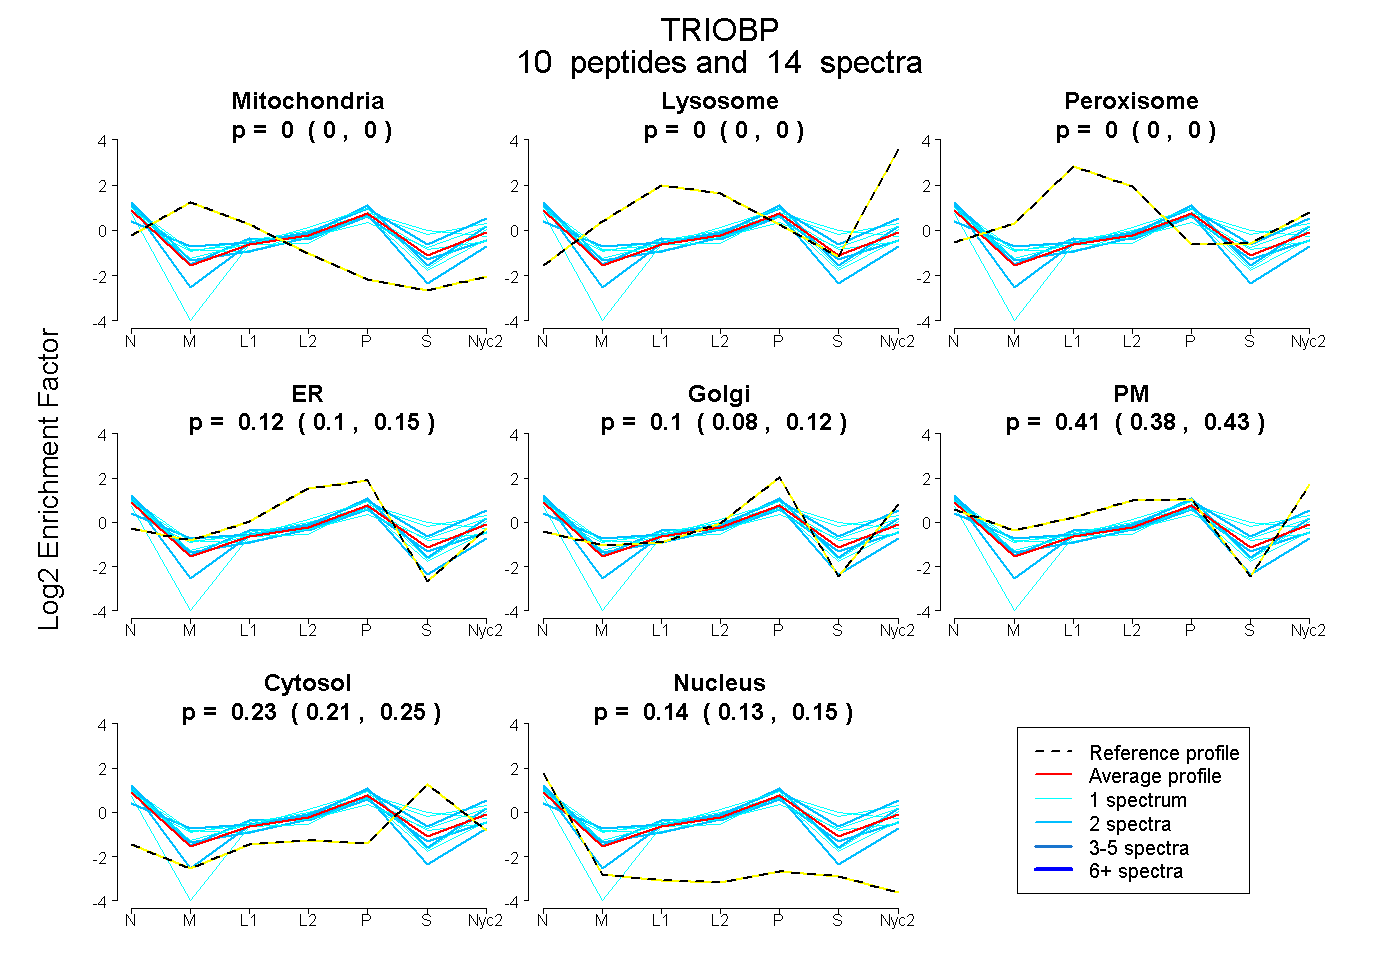
0.000 | 0.000
0.000 | 0.000
0.000 | 0.000
0.095 | 0.148
0.076 | 0.124
0.379 | 0.434
0.205 | 0.249
0.125 | 0.148
6peptides
spectra
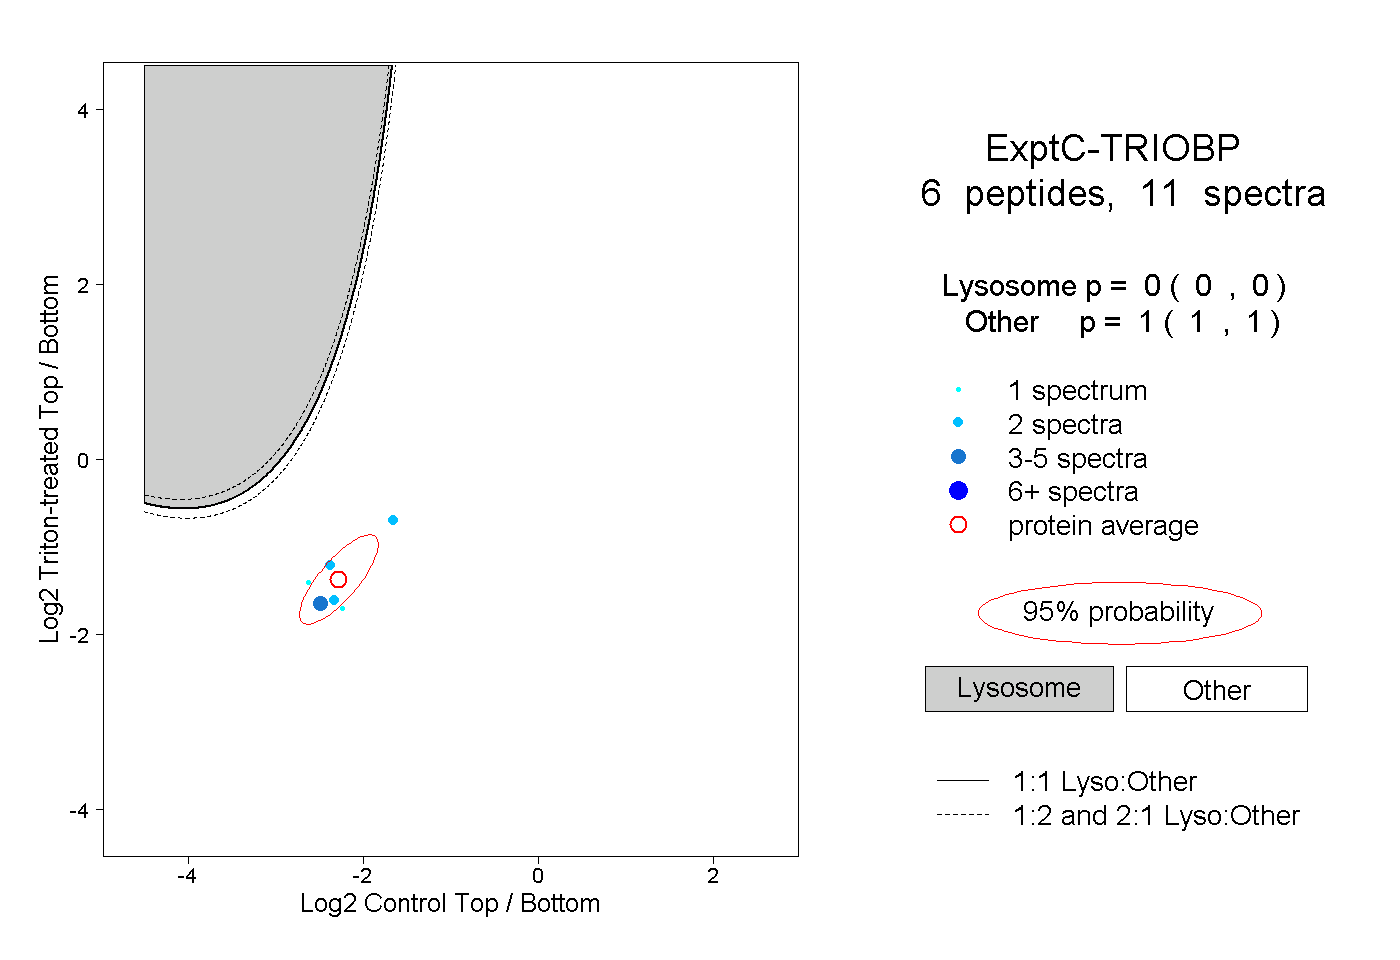
0.000 | 0.000
1.000 | 1.000
1peptide
spectrum
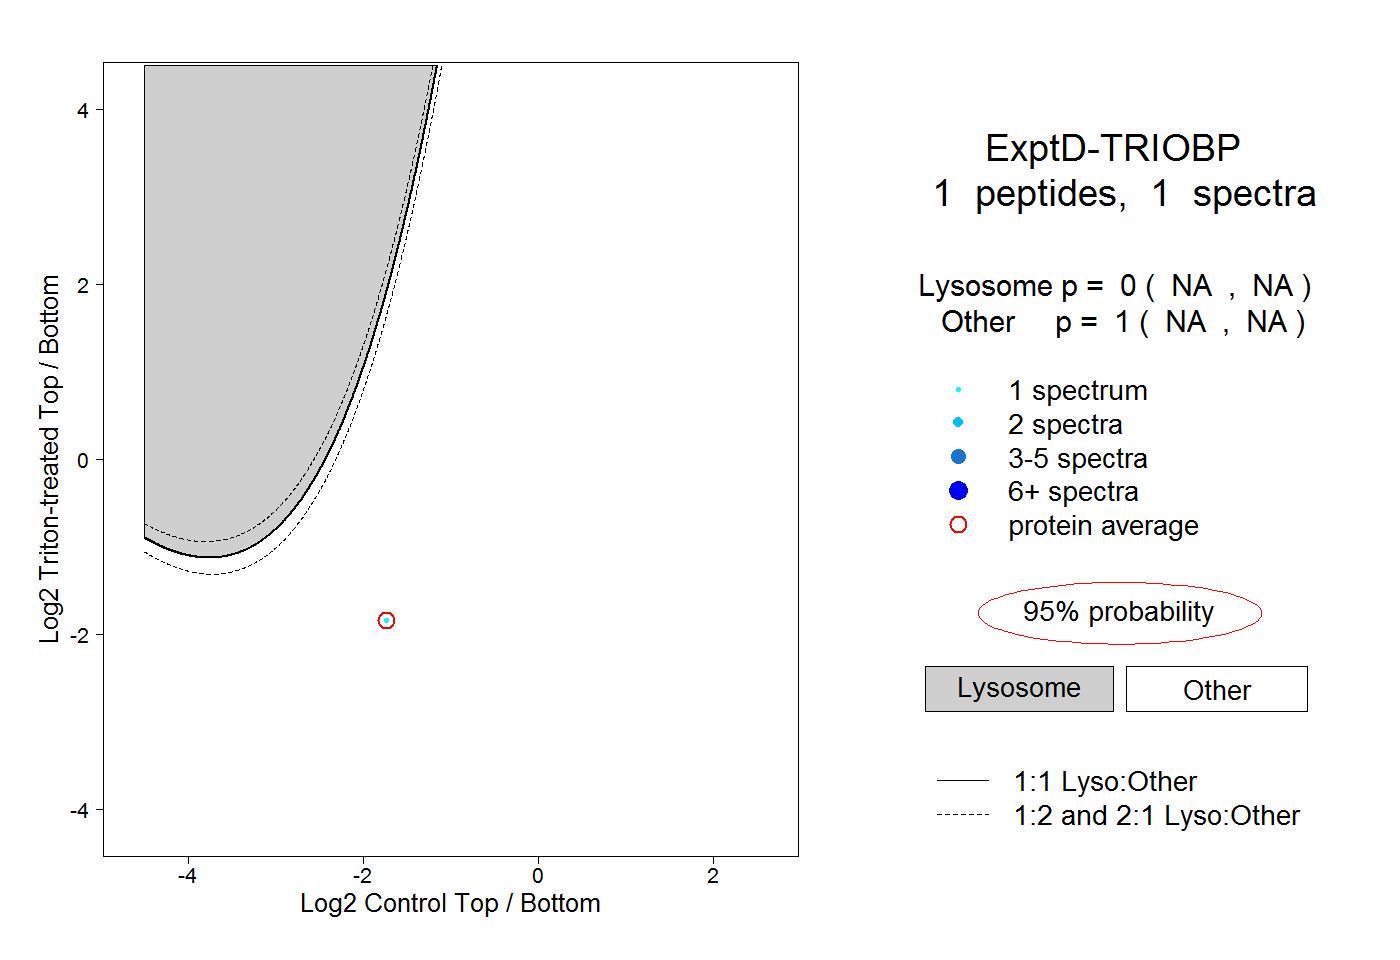
NA | NA
NA | NA