 10
10peptides
spectra
0.000 | 0.000
0.000 | 0.000
0.000 | 0.000
0.095 | 0.148
0.076 | 0.124
0.379 | 0.434
0.205 | 0.249
0.125 | 0.148
6peptides
spectra
0.000 | 0.000
1.000 | 1.000
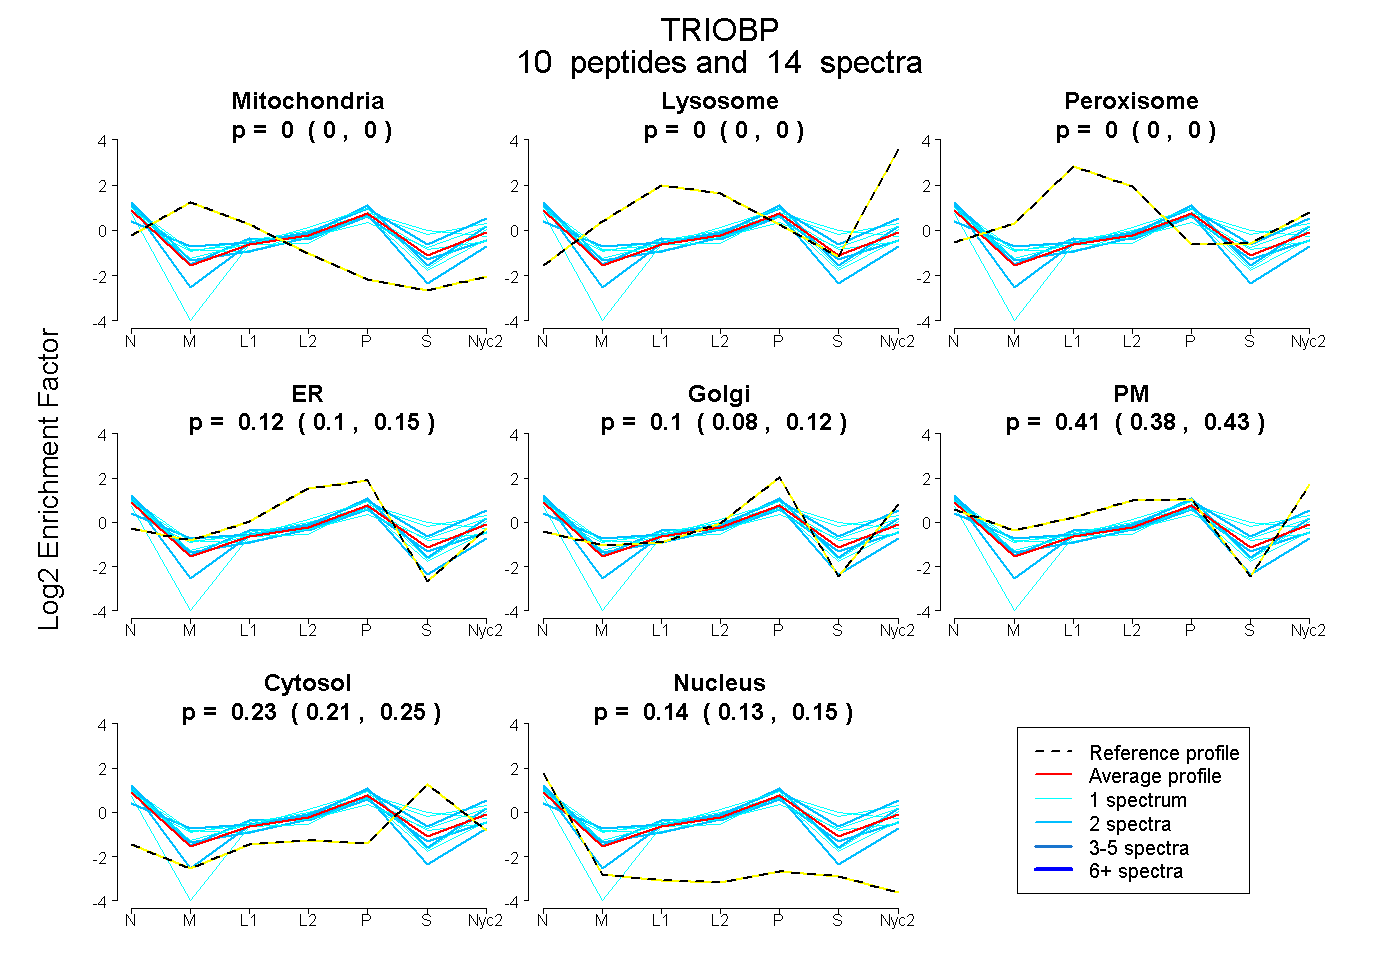
| Plot | Mito | Lyso | Perox | ER | Golgi | PM | Cytosol | Nucleus | |||||
| Expt A |
10 peptides |
14 spectra |
|
0.000 0.000 | 0.000 |
0.000 0.000 | 0.000 |
0.000 0.000 | 0.000 |
0.124 0.095 | 0.148 |
0.102 0.076 | 0.124 |
0.408 0.379 | 0.434 |
0.228 0.205 | 0.249 |
0.137 0.125 | 0.148 |
||
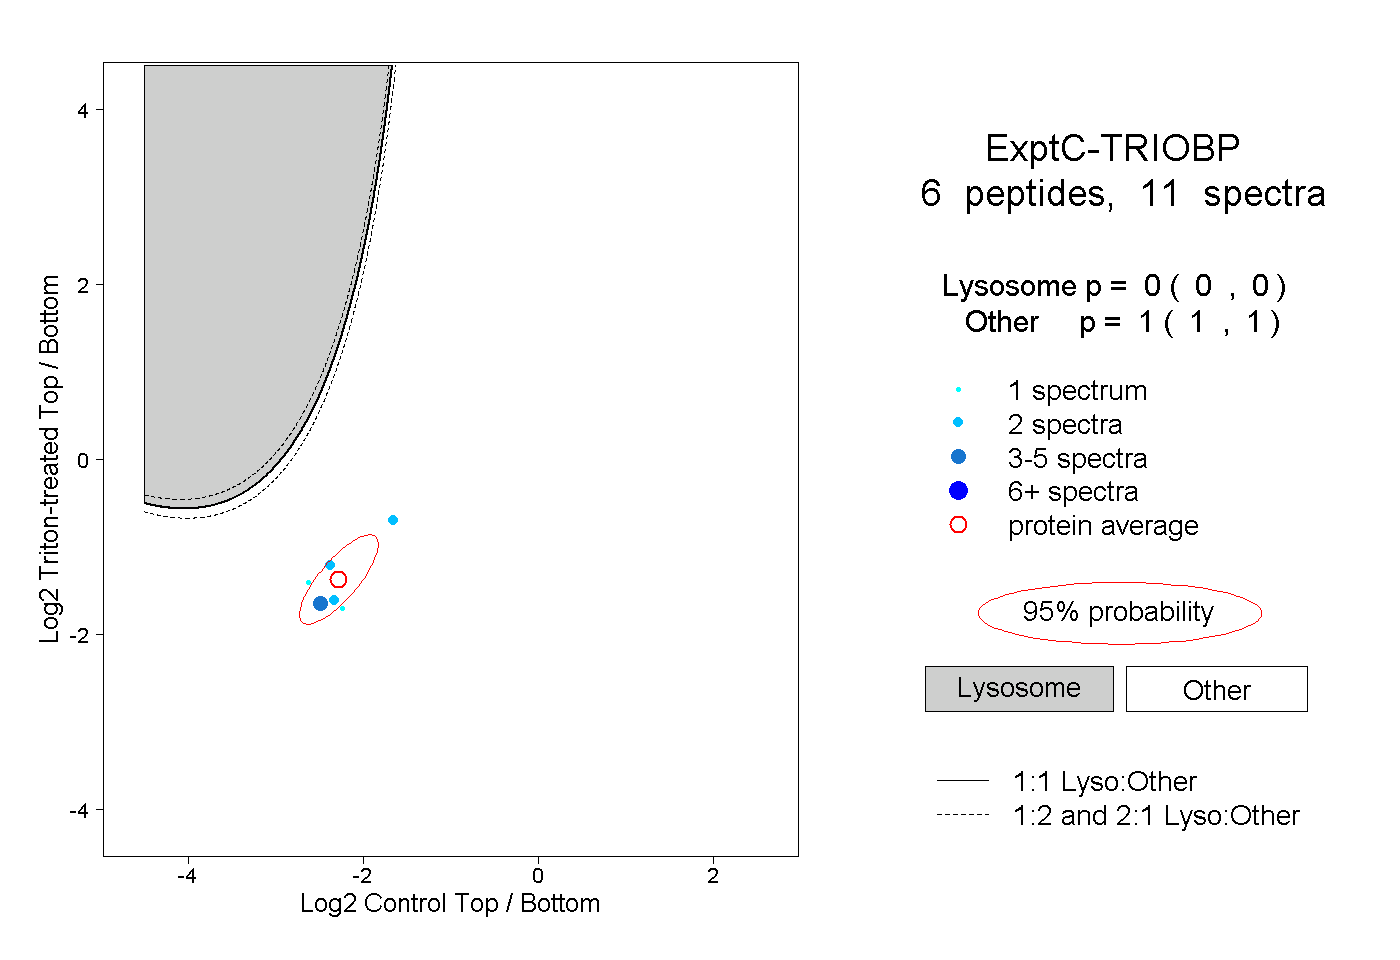
| Plot | Lyso | Other | |||||||||||
| Expt C |
6 peptides |
11 spectra |
|
0.000 0.000 | 0.000 |
1.000 1.000 | 1.000 |
| 1 spectrum, STPERPSK | 0.000 | 1.000 | ||||||||
| 1 spectrum, SCTDVTEYAVQR | 0.000 | 1.000 | ||||||||
| 3 spectra, TVRPTSAPDVTK | 0.000 | 1.000 | ||||||||
| 2 spectra, TPETPSGDGSR | 0.000 | 1.000 | ||||||||
| 2 spectra, GEAPQNAPR | 0.000 | 1.000 | ||||||||
| 2 spectra, AYQEELSR | 0.000 | 1.000 |
| Plot | Lyso | Other | |||||||||||
| Expt D |
1 peptide |
1 spectrum |
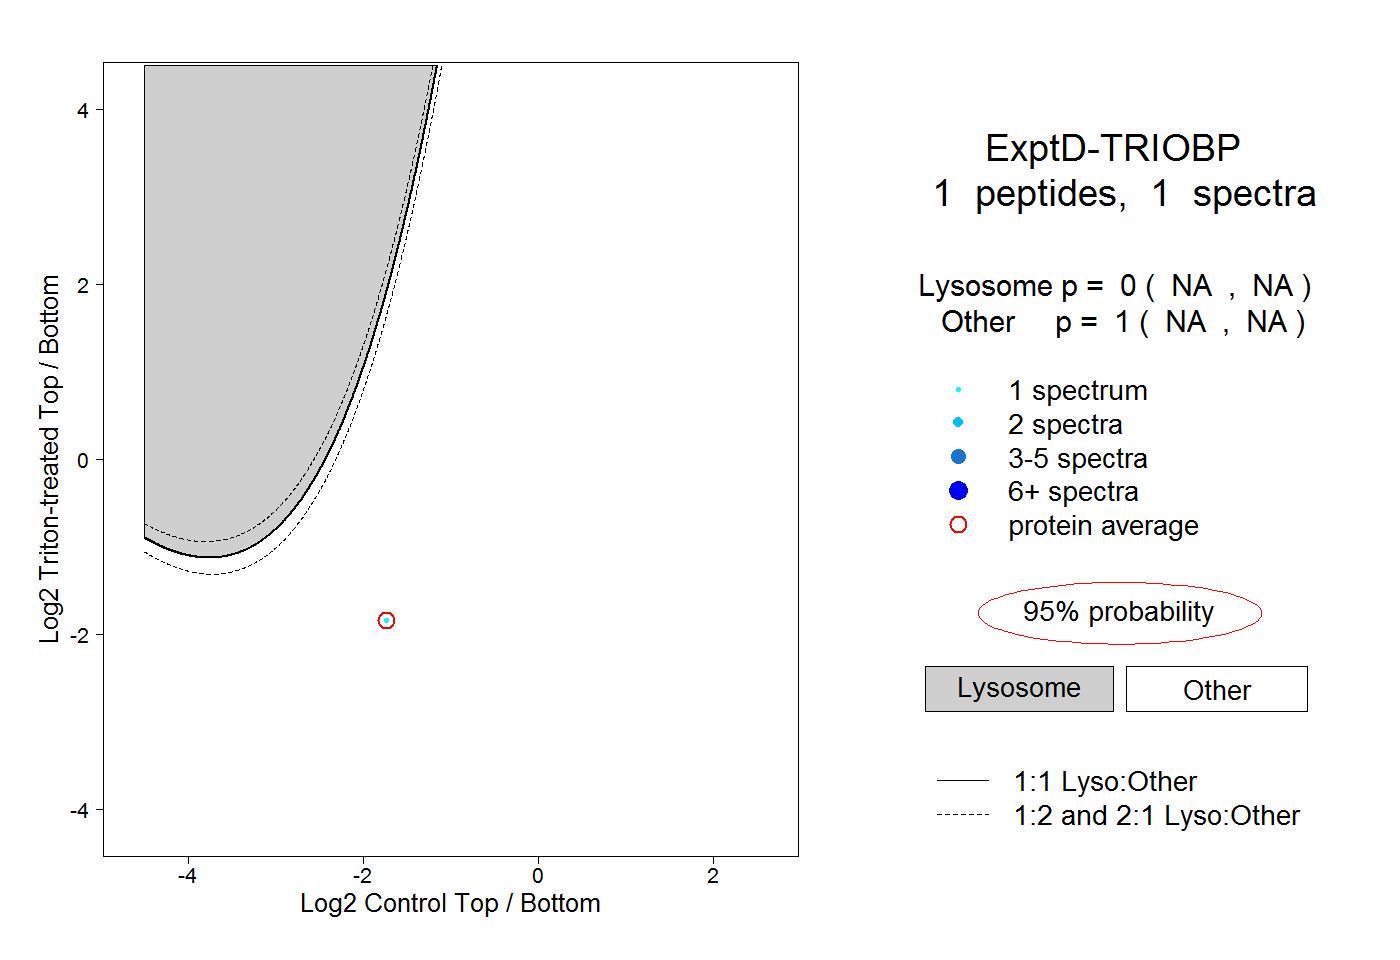 |
0.000 NA | NA |
1.000 NA | NA |