 10
10peptides
spectra
0.000 | 0.000
0.000 | 0.000
0.000 | 0.000
0.095 | 0.148
0.076 | 0.124
0.379 | 0.434
0.205 | 0.249
0.125 | 0.148
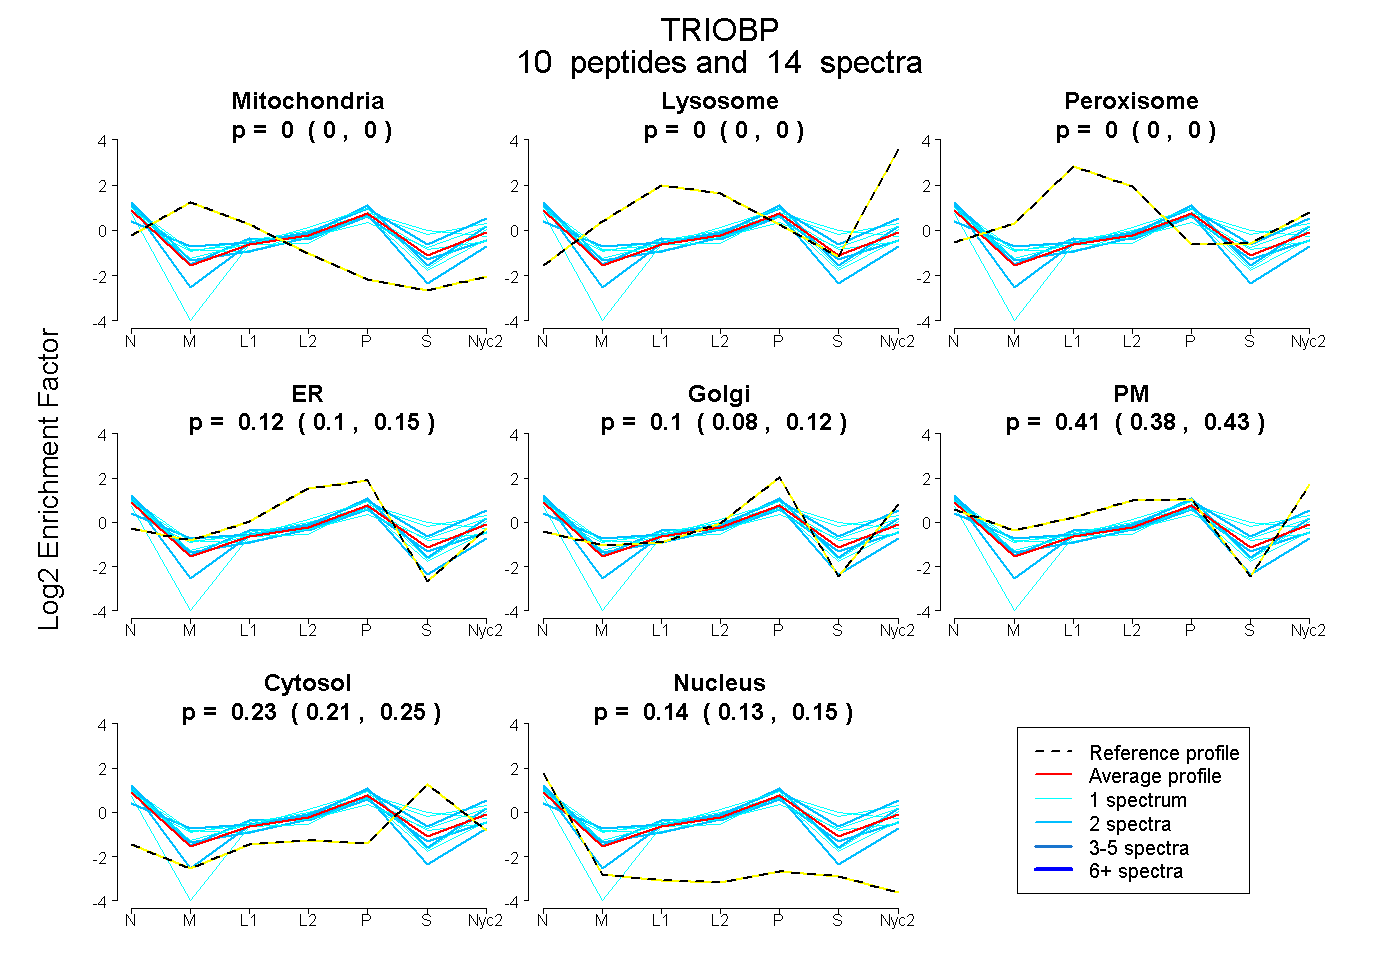
| Plot | Mito | Lyso | Perox | ER | Golgi | PM | Cytosol | Nucleus | |||||
| Expt A |
10 peptides |
14 spectra |
|
0.000 0.000 | 0.000 |
0.000 0.000 | 0.000 |
0.000 0.000 | 0.000 |
0.124 0.095 | 0.148 |
0.102 0.076 | 0.124 |
0.408 0.379 | 0.434 |
0.228 0.205 | 0.249 |
0.137 0.125 | 0.148 |
| 2 spectra, VPLTALLNQGHSER | 0.000 | 0.000 | 0.000 | 0.000 | 0.189 | 0.500 | 0.311 | 0.000 | ||
| 1 spectrum, GWMSILDEPGEWK | 0.000 | 0.000 | 0.001 | 0.067 | 0.000 | 0.526 | 0.406 | 0.000 | ||
| 1 spectrum, CCQQEGQELLR | 0.000 | 0.000 | 0.000 | 0.189 | 0.068 | 0.322 | 0.265 | 0.156 | ||
| 1 spectrum, TVRPTSAPDVTK | 0.000 | 0.000 | 0.000 | 0.000 | 0.000 | 0.586 | 0.299 | 0.115 | ||
| 2 spectra, GLGAPLTDDQQSR | 0.000 | 0.000 | 0.000 | 0.056 | 0.314 | 0.332 | 0.140 | 0.157 | ||
| 2 spectra, AYQEELSR | 0.000 | 0.000 | 0.022 | 0.187 | 0.000 | 0.412 | 0.173 | 0.206 | ||
| 1 spectrum, CLEIGALTR | 0.000 | 0.000 | 0.000 | 0.225 | 0.018 | 0.448 | 0.080 | 0.230 | ||
| 2 spectra, SFIASQGTGNSCGR | 0.000 | 0.000 | 0.000 | 0.274 | 0.107 | 0.312 | 0.000 | 0.307 | ||
| 1 spectrum, WQELEK | 0.000 | 0.000 | 0.000 | 0.187 | 0.092 | 0.484 | 0.098 | 0.140 | ||
| 1 spectrum, TPETPSGDGSR | 0.000 | 0.000 | 0.000 | 0.103 | 0.276 | 0.036 | 0.514 | 0.071 |
| Plot | Lyso | Other | |||||||||||
| Expt C |
6 peptides |
11 spectra |
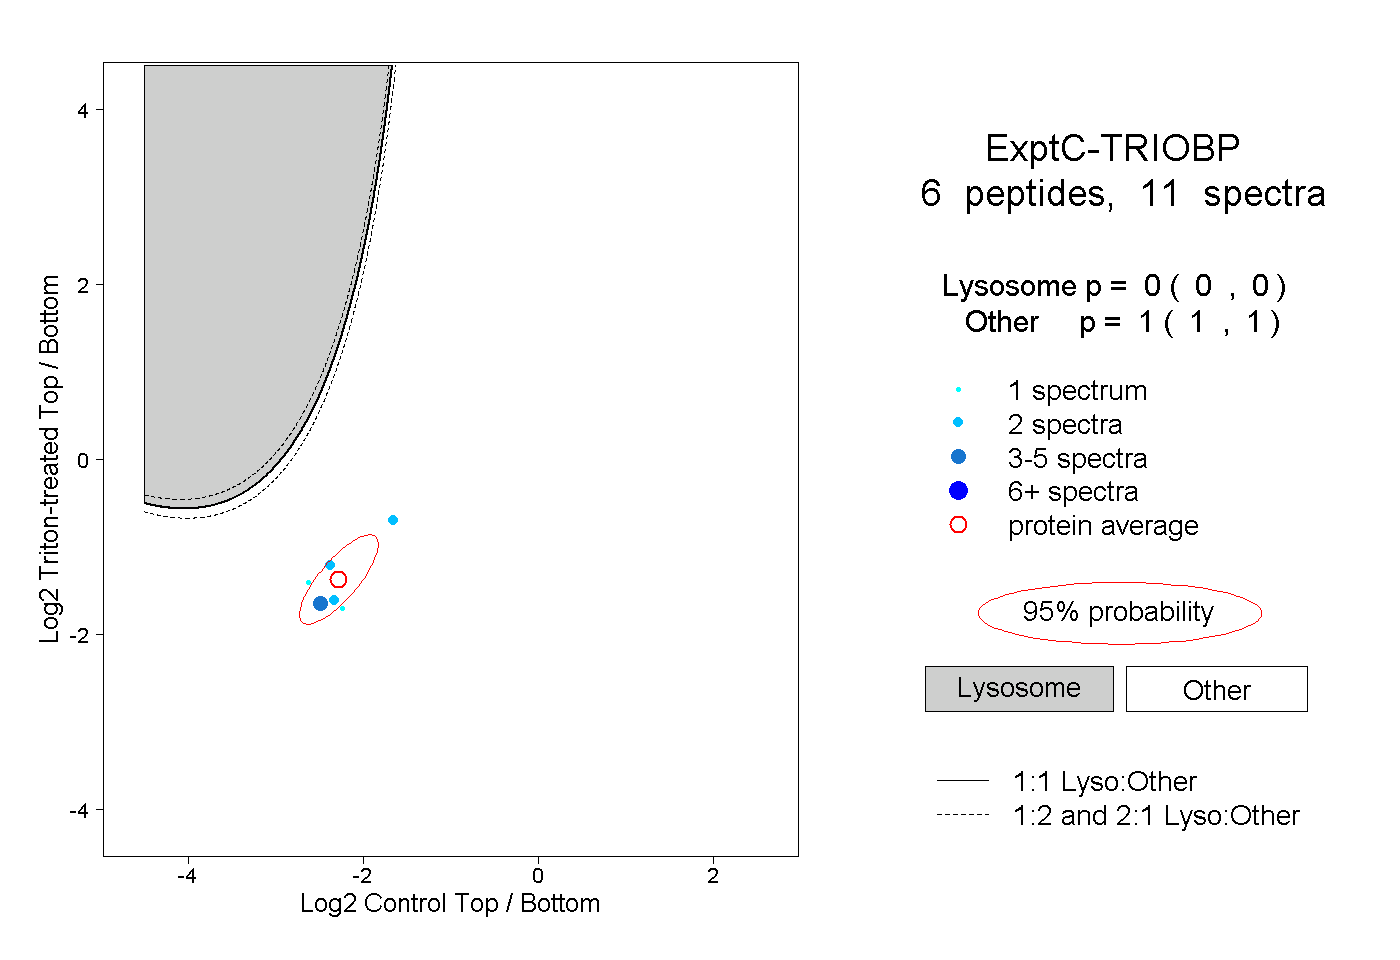 |
0.000 0.000 | 0.000 |
1.000 1.000 | 1.000 |
||||||||
| Plot | Lyso | Other | |||||||||||
| Expt D |
1 peptide |
1 spectrum |
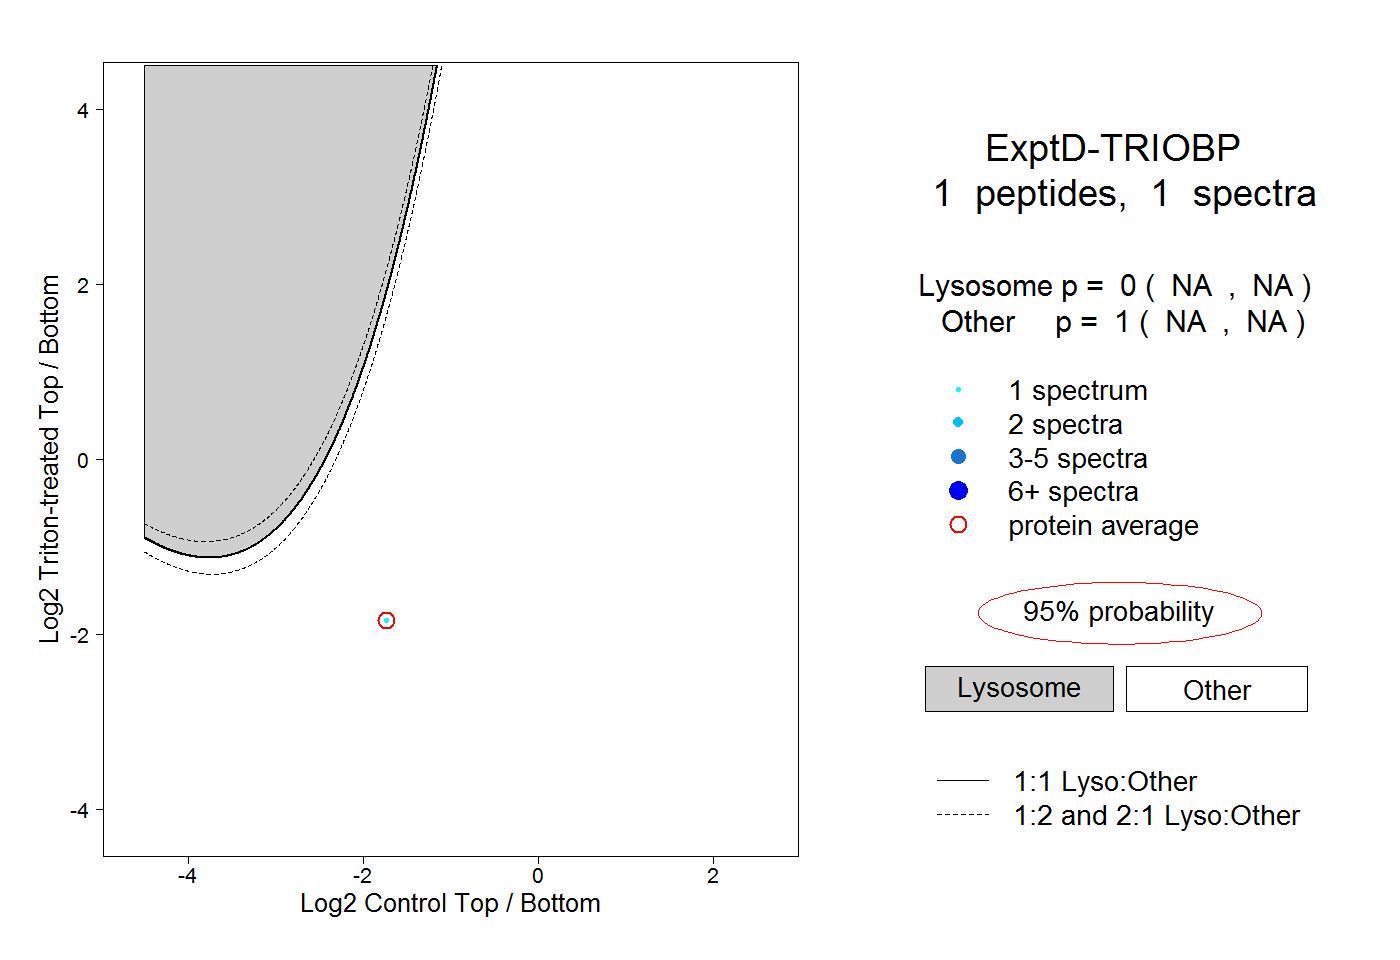 |
0.000 NA | NA |
1.000 NA | NA |