 28
28peptides
spectra
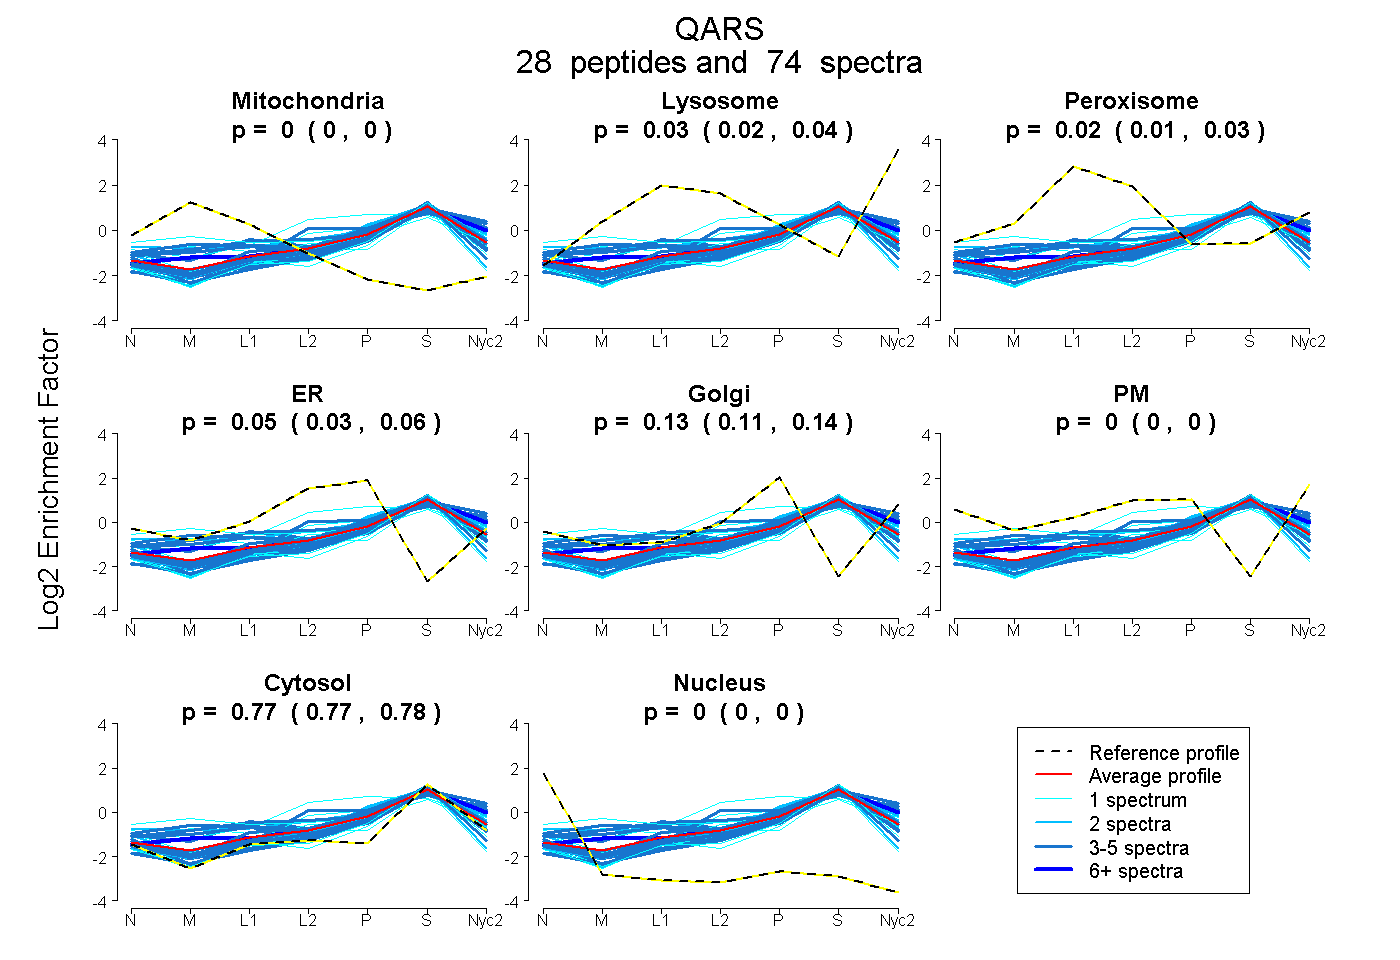
0.000 | 0.000
0.022 | 0.040
0.009 | 0.031
0.029 | 0.058
0.114 | 0.143
0.000 | 0.000
0.768 | 0.776
0.000 | 0.000
11peptides
spectra
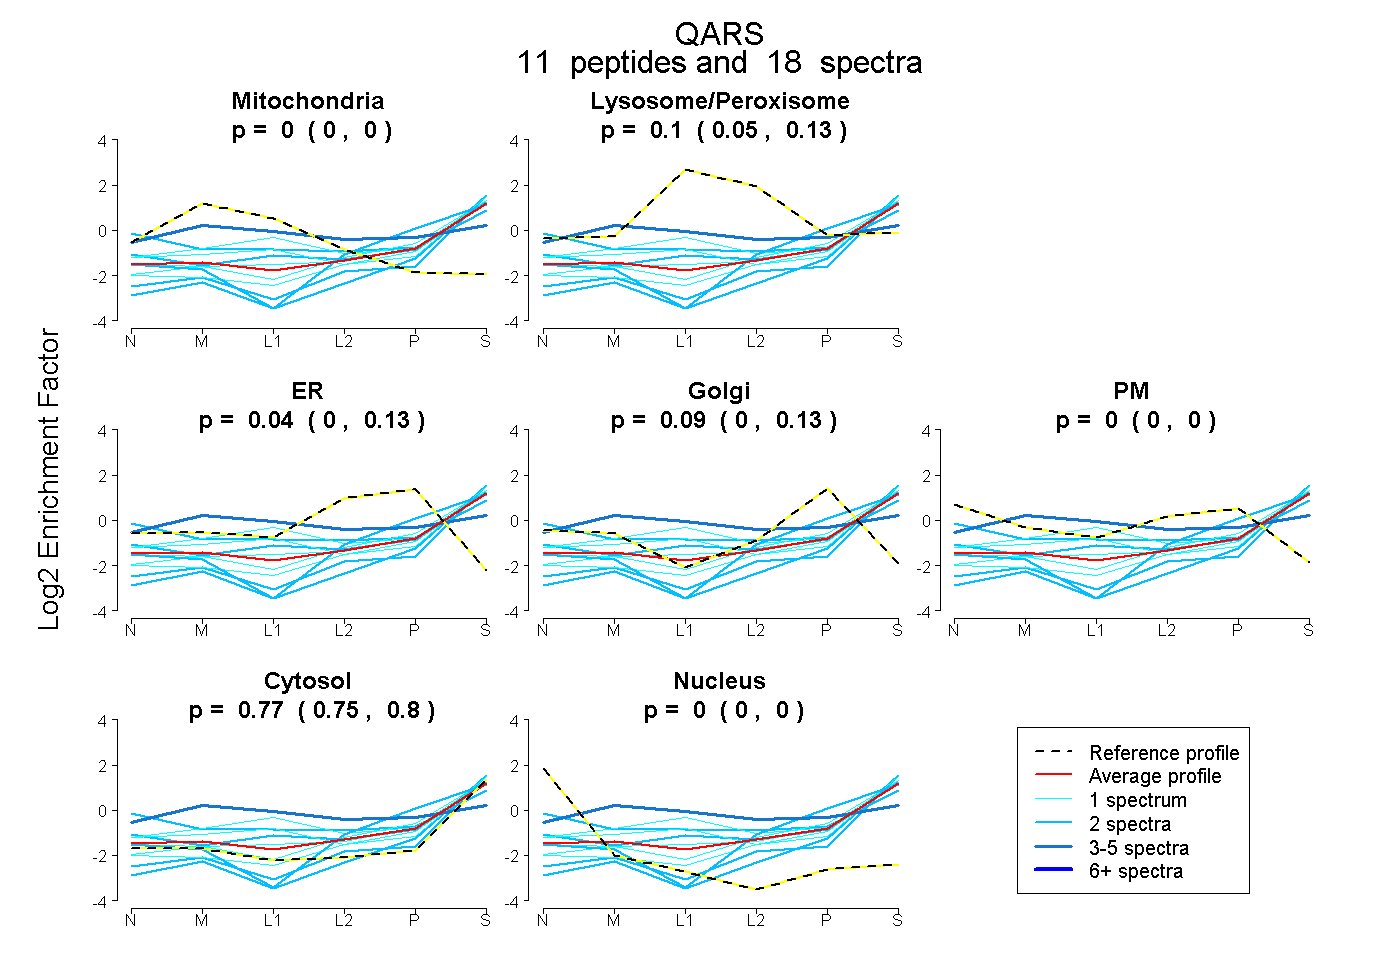
0.000 | 0.000
0.046 | 0.132
0.000 | 0.132
0.000 | 0.133
0.000 | 0.000
0.746 | 0.797
0.000 | 0.000
20peptides
spectra
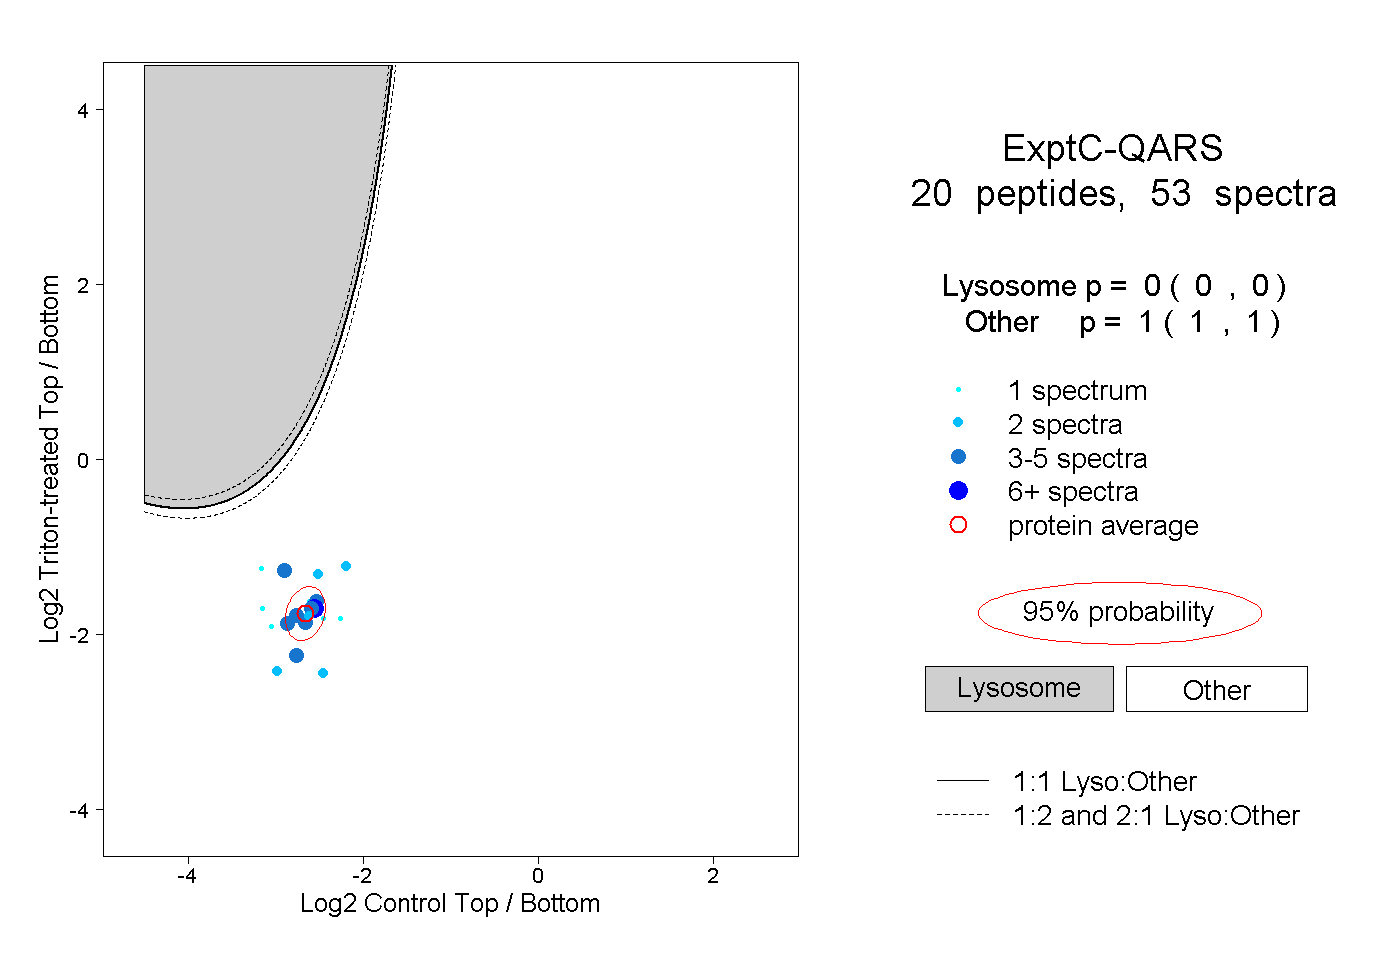
0.000 | 0.000
1.000 | 1.000
3peptides
spectra
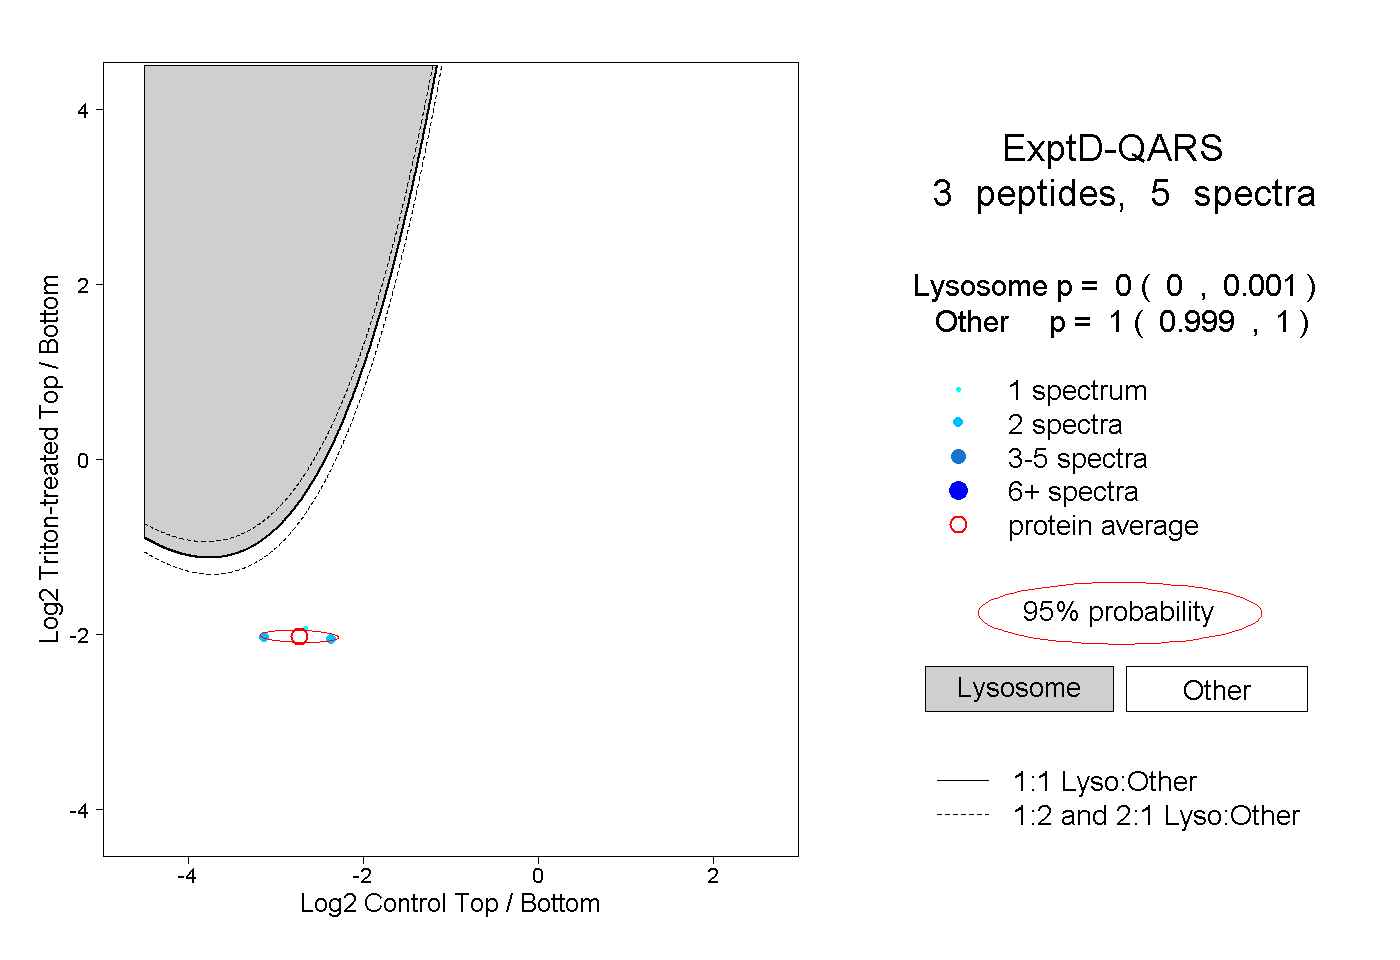
0.000 | 0.001
0.999 | 1.000