 28
28peptides
spectra
0.000 | 0.000
0.022 | 0.040
0.009 | 0.031
0.029 | 0.058
0.114 | 0.143
0.000 | 0.000
0.768 | 0.776
0.000 | 0.000
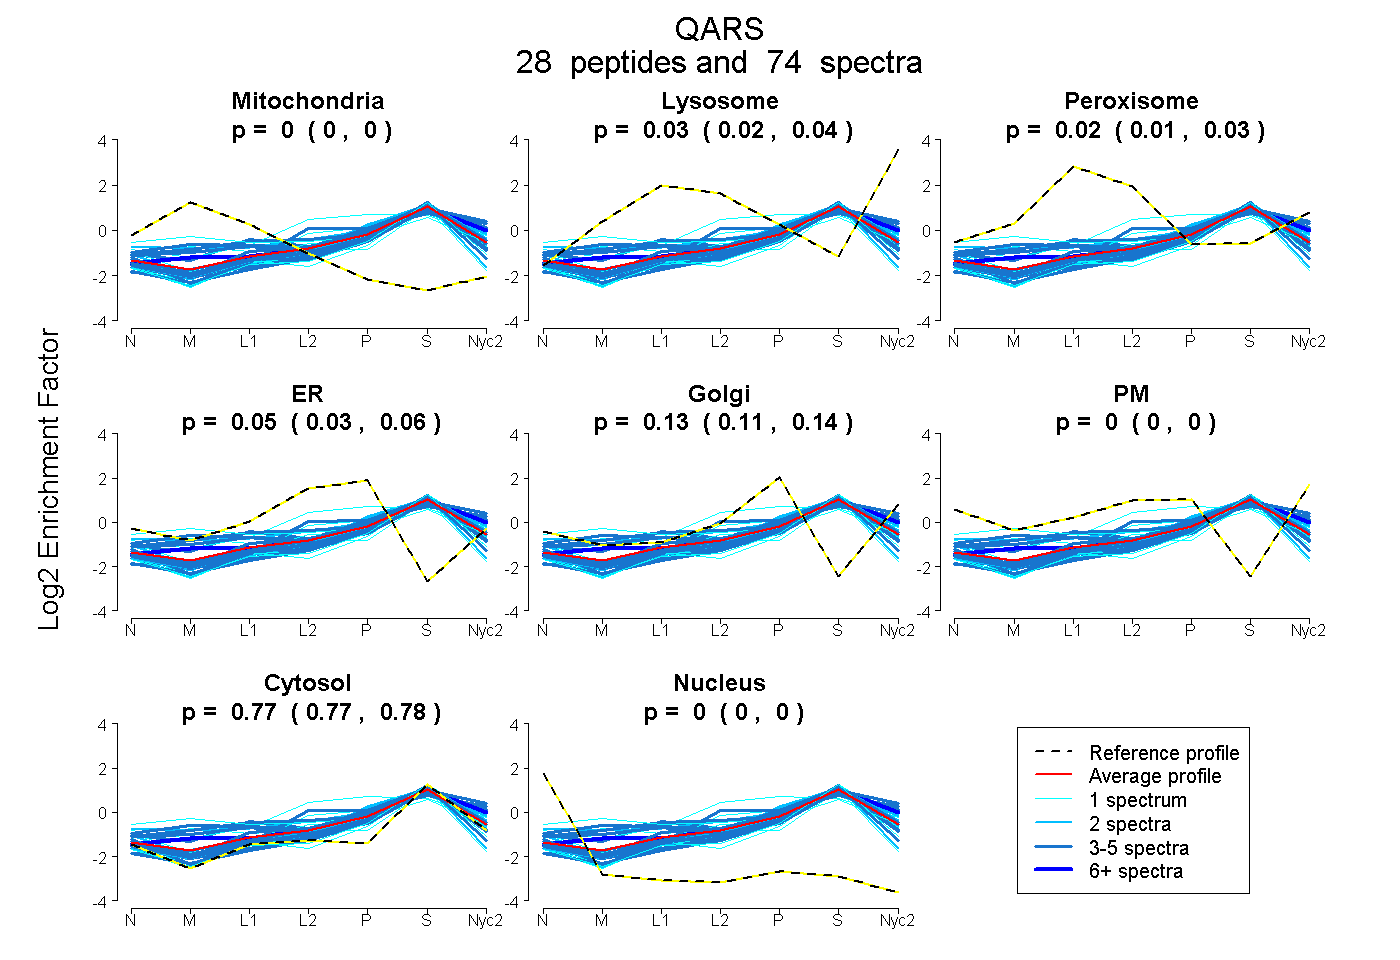
| Plot | Mito | Lyso | Perox | ER | Golgi | PM | Cytosol | Nucleus | |||||
| Expt A |
28 peptides |
74 spectra |
|
0.000 0.000 | 0.000 |
0.032 0.022 | 0.040 |
0.021 0.009 | 0.031 |
0.045 0.029 | 0.058 |
0.129 0.114 | 0.143 |
0.000 0.000 | 0.000 |
0.772 0.768 | 0.776 |
0.000 0.000 | 0.000 |
| 3 spectra, VGVTVAQTTMEPHLLEACVR | 0.000 | 0.000 | 0.000 | 0.132 | 0.000 | 0.000 | 0.868 | 0.000 | ||
| 1 spectrum, FAEGEATLR | 0.000 | 0.000 | 0.000 | 0.000 | 0.129 | 0.000 | 0.871 | 0.000 | ||
| 1 spectrum, LEETDR | 0.000 | 0.070 | 0.000 | 0.053 | 0.020 | 0.000 | 0.856 | 0.000 | ||
| 4 spectra, MDPVAYR | 0.000 | 0.000 | 0.000 | 0.062 | 0.078 | 0.000 | 0.859 | 0.000 | ||
| 1 spectrum, EAATQAQQTLGSTIDK | 0.146 | 0.029 | 0.098 | 0.000 | 0.027 | 0.000 | 0.701 | 0.000 | ||
| 2 spectra, ANNGICFLR | 0.000 | 0.000 | 0.000 | 0.153 | 0.000 | 0.000 | 0.847 | 0.000 | ||
| 2 spectra, ATGTLLYGLASR | 0.000 | 0.000 | 0.000 | 0.000 | 0.228 | 0.000 | 0.772 | 0.000 | ||
| 2 spectra, ADAGEKPK | 0.000 | 0.000 | 0.000 | 0.036 | 0.162 | 0.000 | 0.802 | 0.000 | ||
| 1 spectrum, NEVDMQVLHLLGPK | 0.018 | 0.000 | 0.000 | 0.000 | 0.068 | 0.000 | 0.914 | 0.000 | ||
| 2 spectra, GHNPLPSPWR | 0.000 | 0.000 | 0.204 | 0.000 | 0.233 | 0.000 | 0.563 | 0.000 | ||
| 4 spectra, AINFNFGYAK | 0.000 | 0.147 | 0.092 | 0.000 | 0.096 | 0.000 | 0.664 | 0.000 | ||
| 7 spectra, LFTLTALR | 0.000 | 0.138 | 0.000 | 0.000 | 0.154 | 0.000 | 0.708 | 0.000 | ||
| 3 spectra, SHPLDPIDTK | 0.021 | 0.240 | 0.000 | 0.000 | 0.052 | 0.000 | 0.686 | 0.000 | ||
| 4 spectra, MEADLEK | 0.000 | 0.000 | 0.000 | 0.113 | 0.091 | 0.000 | 0.796 | 0.000 | ||
| 4 spectra, HRPQLLVER | 0.000 | 0.125 | 0.157 | 0.000 | 0.122 | 0.000 | 0.596 | 0.000 | ||
| 4 spectra, LNLHYAVVSK | 0.000 | 0.000 | 0.000 | 0.243 | 0.000 | 0.000 | 0.757 | 0.000 | ||
| 1 spectrum, VPNFPADETK | 0.000 | 0.000 | 0.000 | 0.000 | 0.071 | 0.000 | 0.929 | 0.000 | ||
| 2 spectra, AFIHWVSQPLVCEIR | 0.000 | 0.012 | 0.021 | 0.000 | 0.157 | 0.000 | 0.811 | 0.000 | ||
| 5 spectra, DRPIEESLLLFEAMR | 0.000 | 0.000 | 0.000 | 0.000 | 0.155 | 0.000 | 0.845 | 0.000 | ||
| 1 spectrum, QHLEITGGQVR | 0.136 | 0.000 | 0.206 | 0.000 | 0.159 | 0.000 | 0.500 | 0.000 | ||
| 5 spectra, LAWGQPVGLR | 0.000 | 0.000 | 0.000 | 0.000 | 0.110 | 0.000 | 0.890 | 0.000 | ||
| 1 spectrum, GFHQVPFASTVFIER | 0.000 | 0.083 | 0.048 | 0.347 | 0.000 | 0.000 | 0.522 | 0.000 | ||
| 3 spectra, TPGYVTTPHTMDLLK | 0.000 | 0.071 | 0.000 | 0.077 | 0.069 | 0.000 | 0.783 | 0.000 | ||
| 1 spectrum, GSSGCVECLEVTCR | 0.000 | 0.000 | 0.000 | 0.256 | 0.000 | 0.000 | 0.744 | 0.000 | ||
| 2 spectra, NAALSTQLR | 0.000 | 0.039 | 0.000 | 0.000 | 0.148 | 0.000 | 0.813 | 0.000 | ||
| 3 spectra, HTGYVIELQHVVR | 0.000 | 0.059 | 0.000 | 0.000 | 0.085 | 0.000 | 0.856 | 0.000 | ||
| 3 spectra, ILQLVAAGAVR | 0.031 | 0.198 | 0.019 | 0.000 | 0.179 | 0.000 | 0.572 | 0.000 | ||
| 2 spectra, FSMGLLMGEAR | 0.000 | 0.042 | 0.000 | 0.000 | 0.194 | 0.000 | 0.764 | 0.000 |
| Plot | Mito | Lyso or Perox | ER | Golgi | PM | Cytosol | Nucleus | ||||||
| Expt B |
11 peptides |
18 spectra |
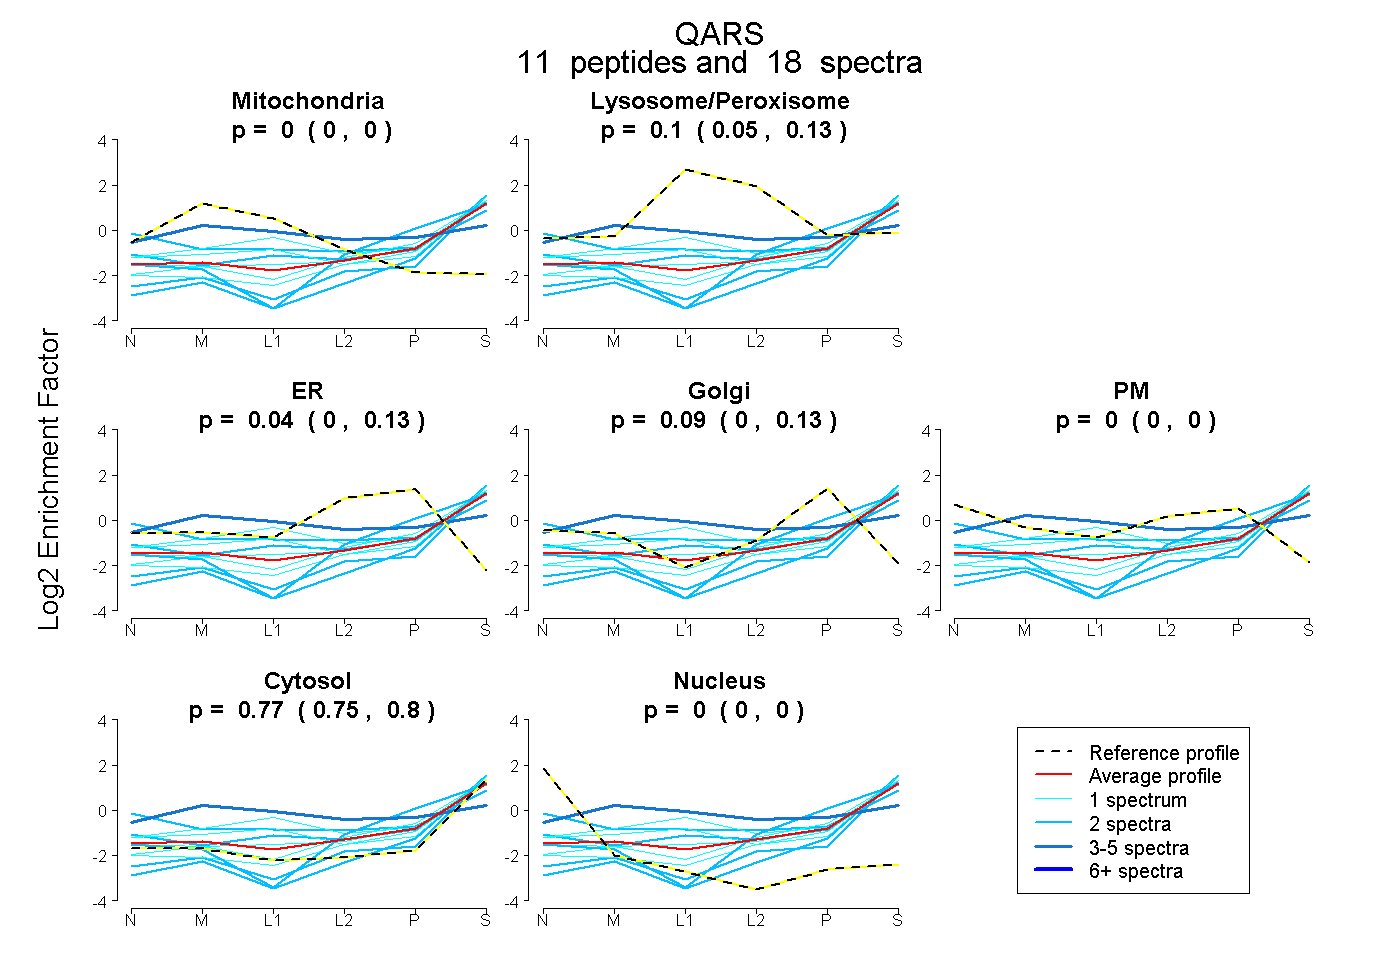 |
0.000 0.000 | 0.000 |
0.099 0.046 | 0.132 |
0.041 0.000 | 0.132 |
0.090 0.000 | 0.133 |
0.000 0.000 | 0.000 |
0.770 0.746 | 0.797 |
0.000 0.000 | 0.000 |
|||
| Plot | Lyso | Other | |||||||||||
| Expt C |
20 peptides |
53 spectra |
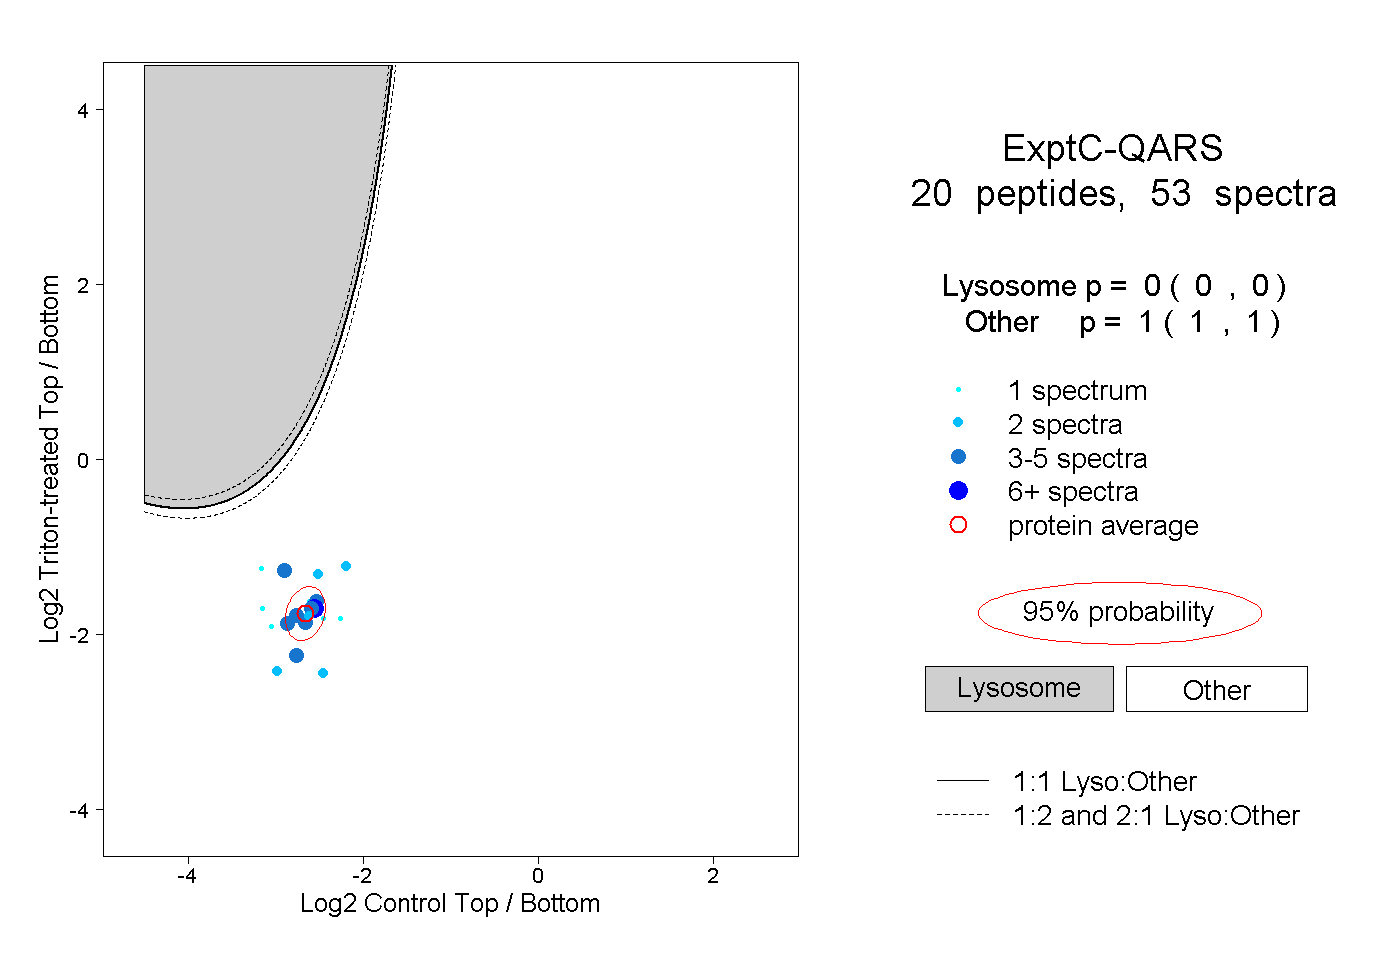 |
0.000 0.000 | 0.000 |
1.000 1.000 | 1.000 |
||||||||
| Plot | Lyso | Other | |||||||||||
| Expt D |
3 peptides |
5 spectra |
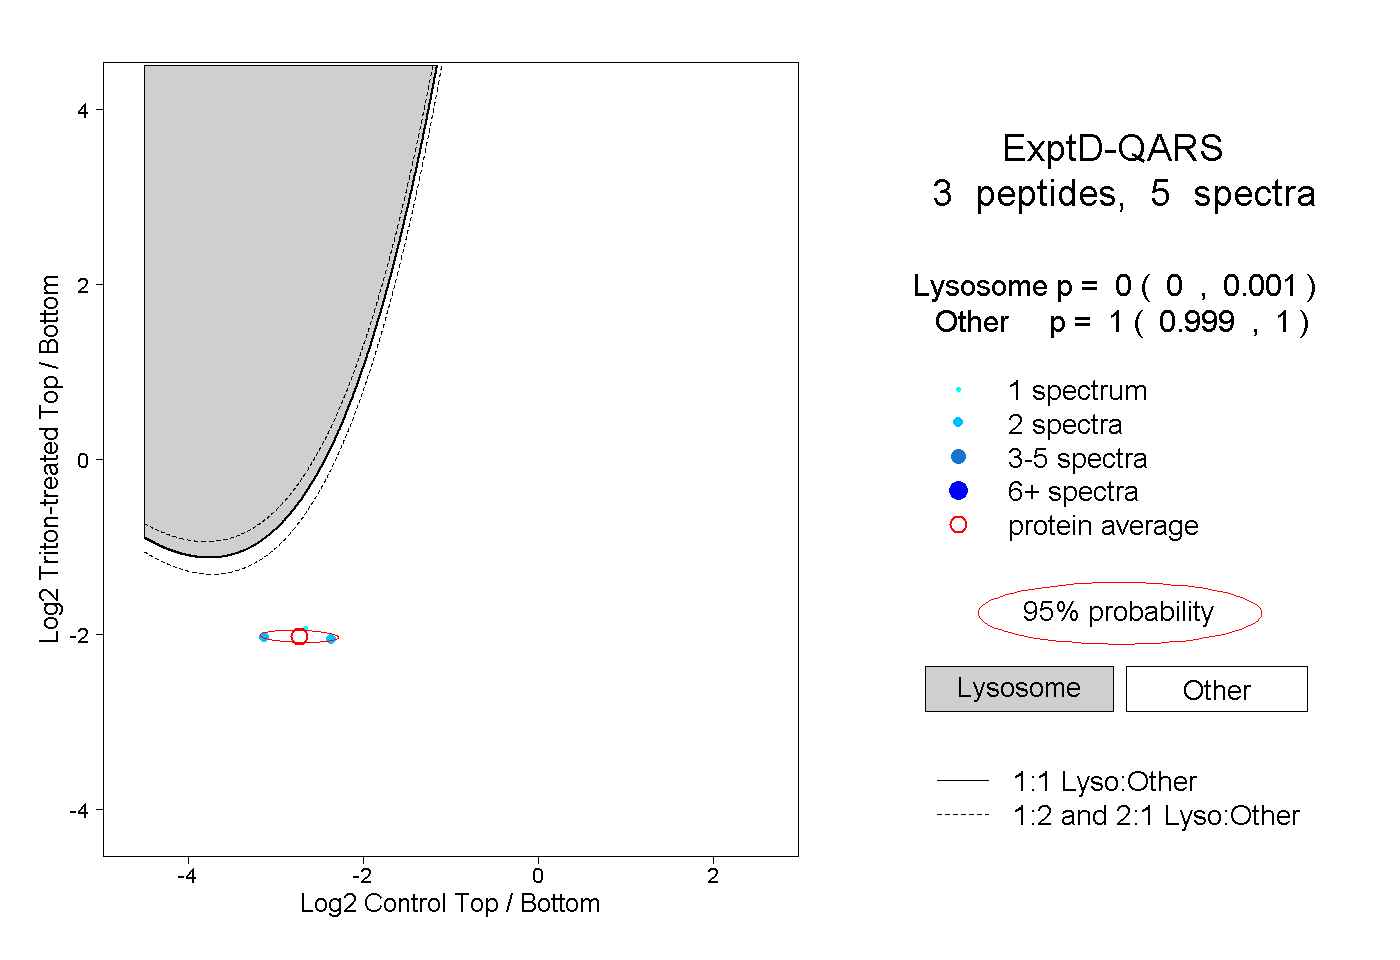 |
0.000 0.000 | 0.001 |
1.000 0.999 | 1.000 |