 6
6peptides
spectra
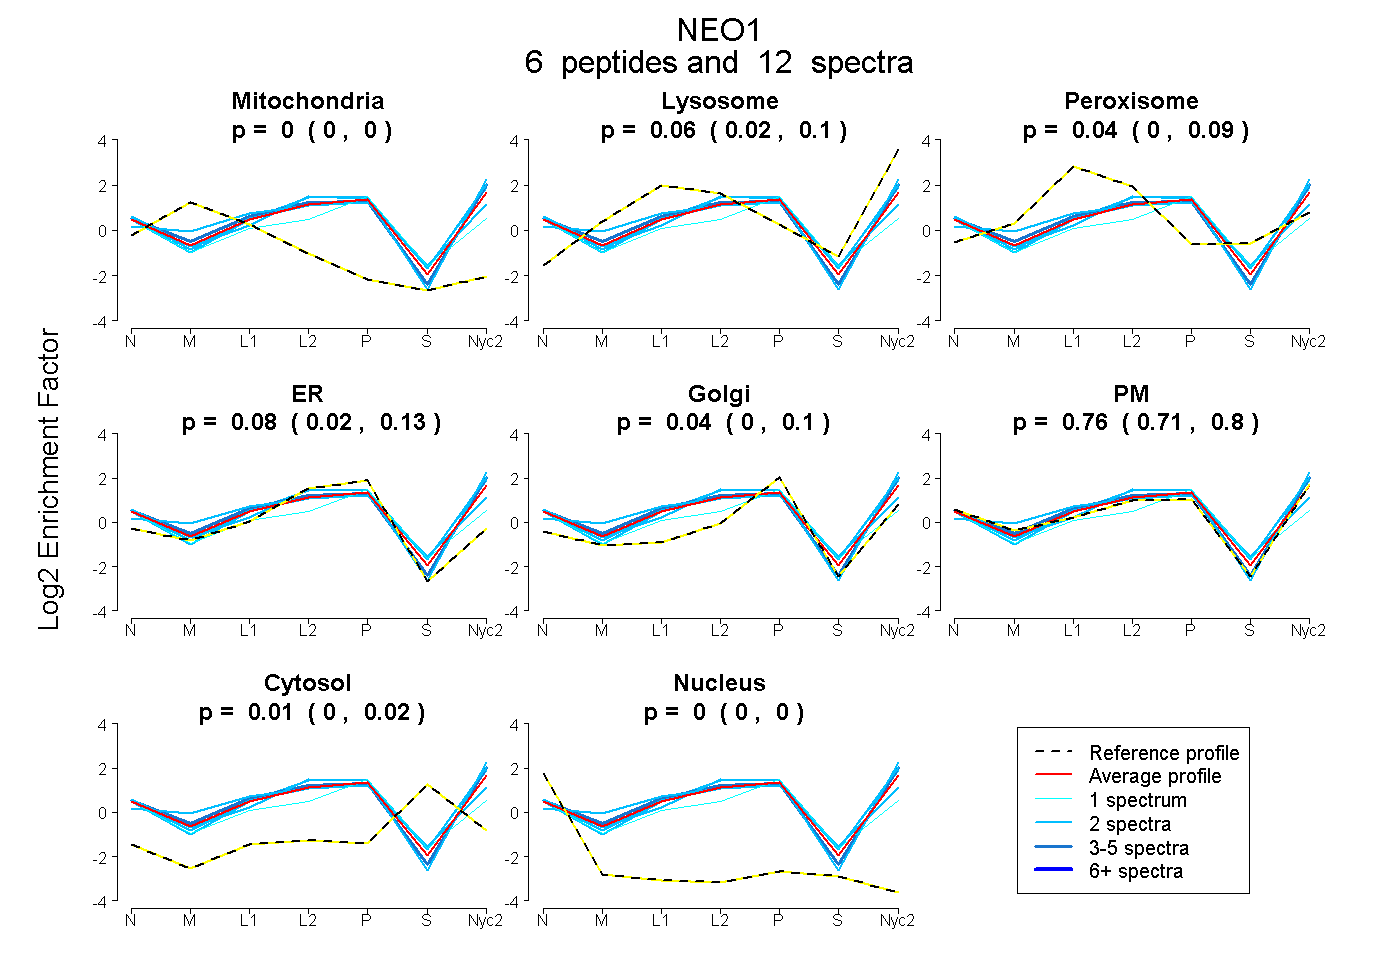
0.000 | 0.000
0.019 | 0.097
0.000 | 0.088
0.021 | 0.127
0.000 | 0.105
0.714 | 0.800
0.000 | 0.022
0.000 | 0.000
2peptides
spectra
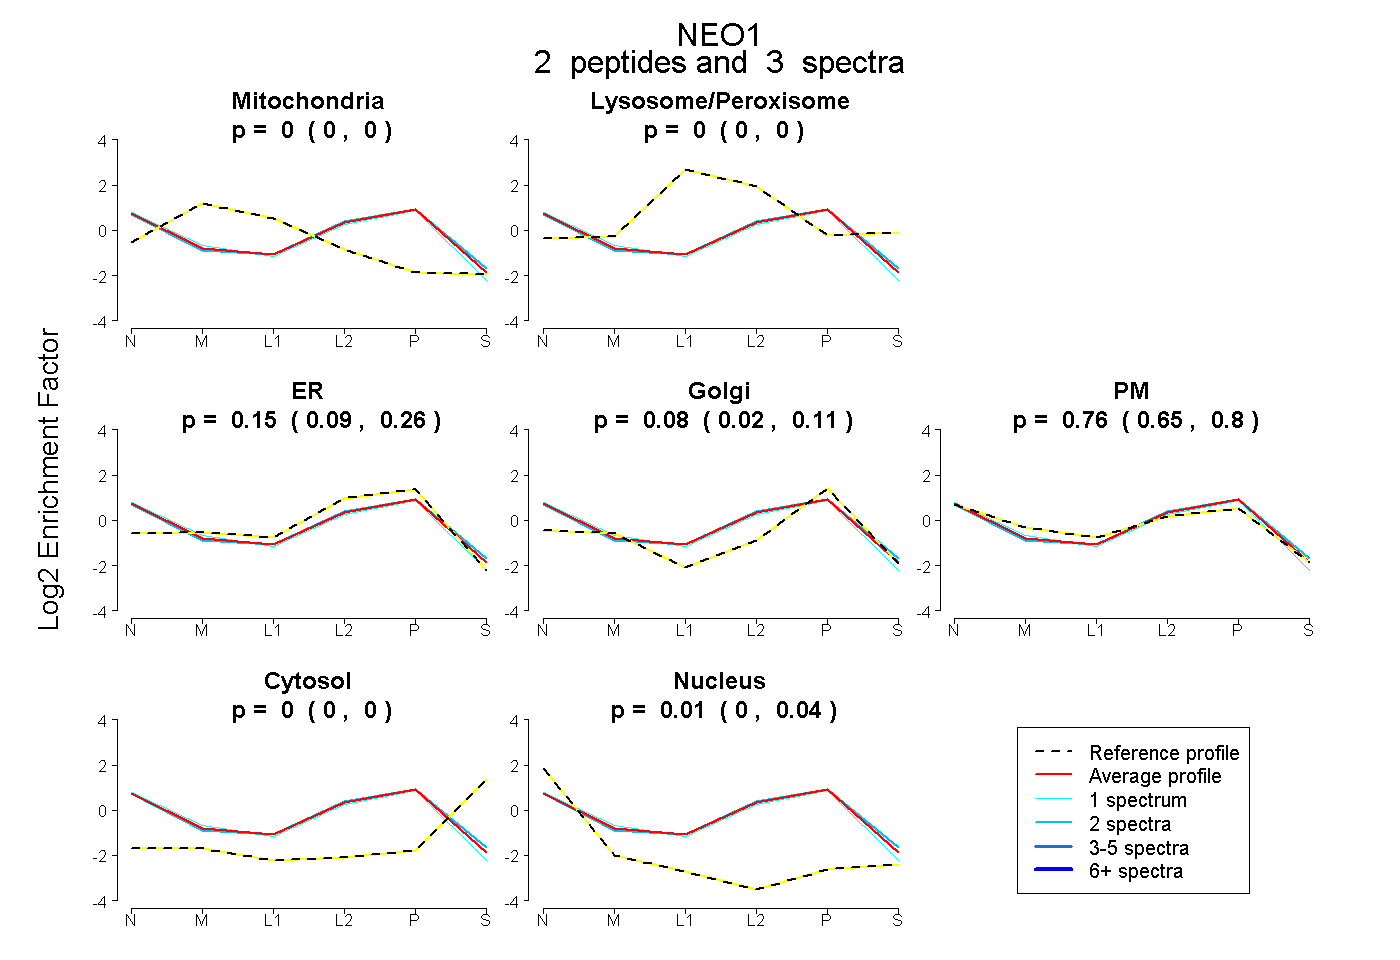
0.000 | 0.000
0.000 | 0.000
0.093 | 0.259
0.024 | 0.107
0.650 | 0.804
0.000 | 0.004
0.000 | 0.042
10peptides
spectra
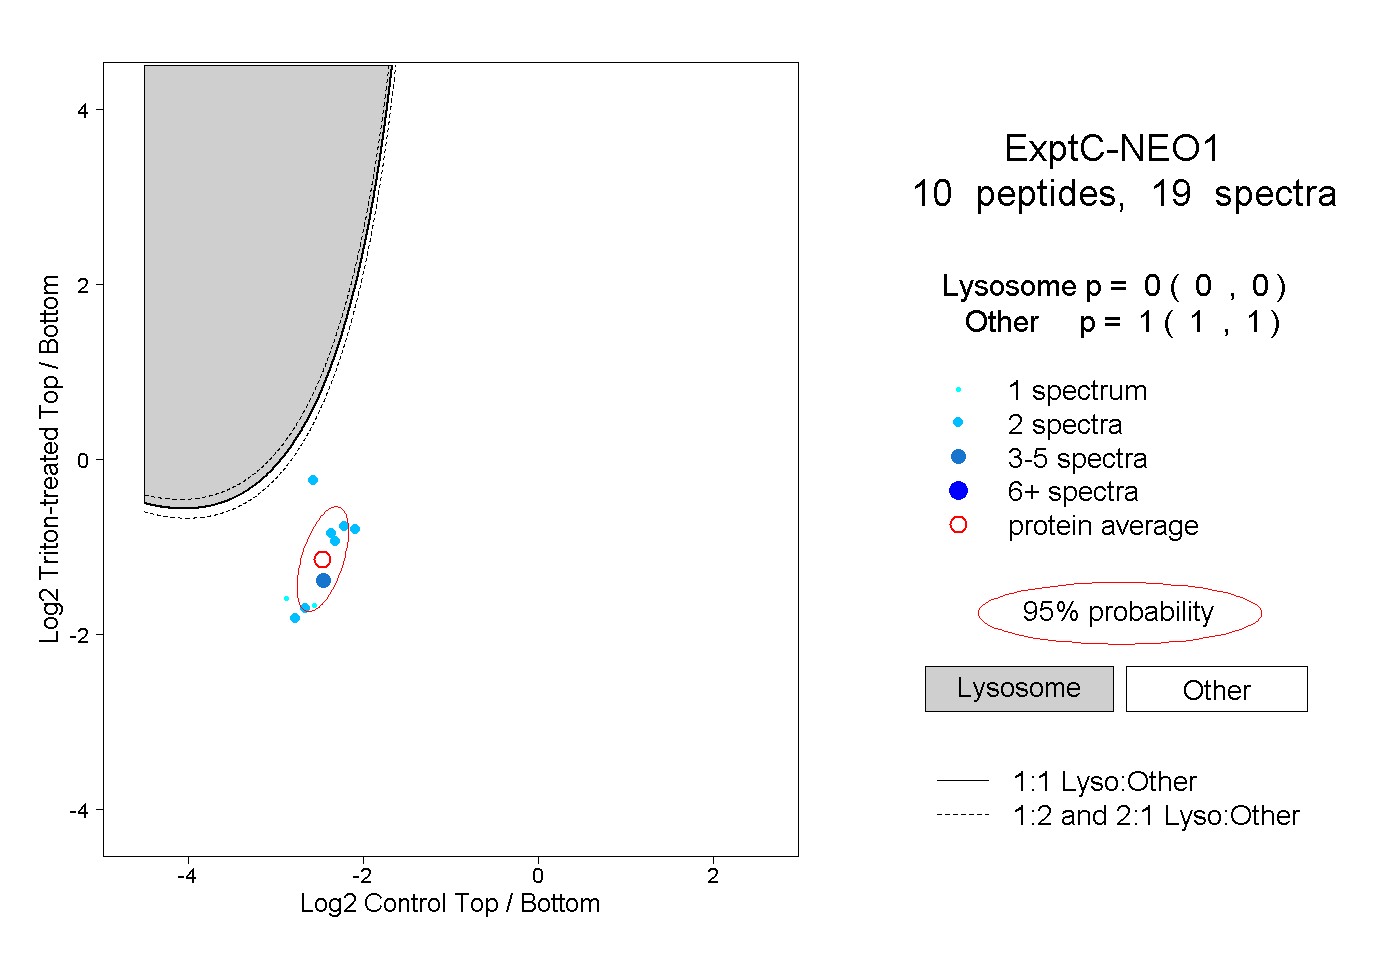
0.000 | 0.000
1.000 | 1.000
2peptides
spectra
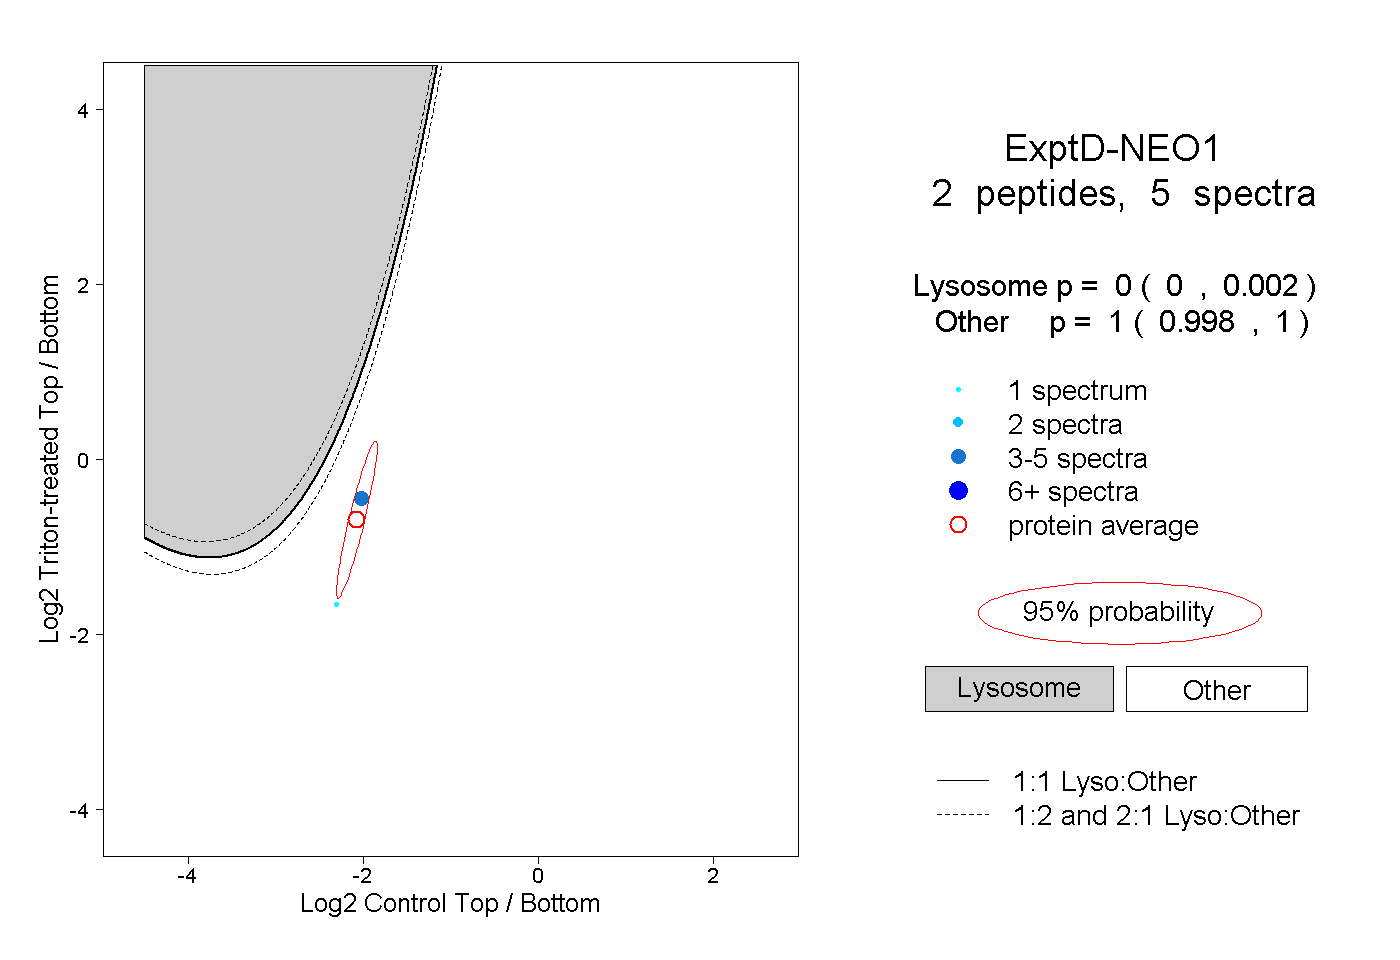
0.000 | 0.002
0.998 | 1.000