NEO1
[ENSRNOP00000060347]
Main page
| | | Plot |
Mito |
Lyso |
|
Perox |
ER |
Golgi |
PM |
Cytosol |
Nucleus |
|
| Expt A |
 6
6
peptides |
12
spectra |
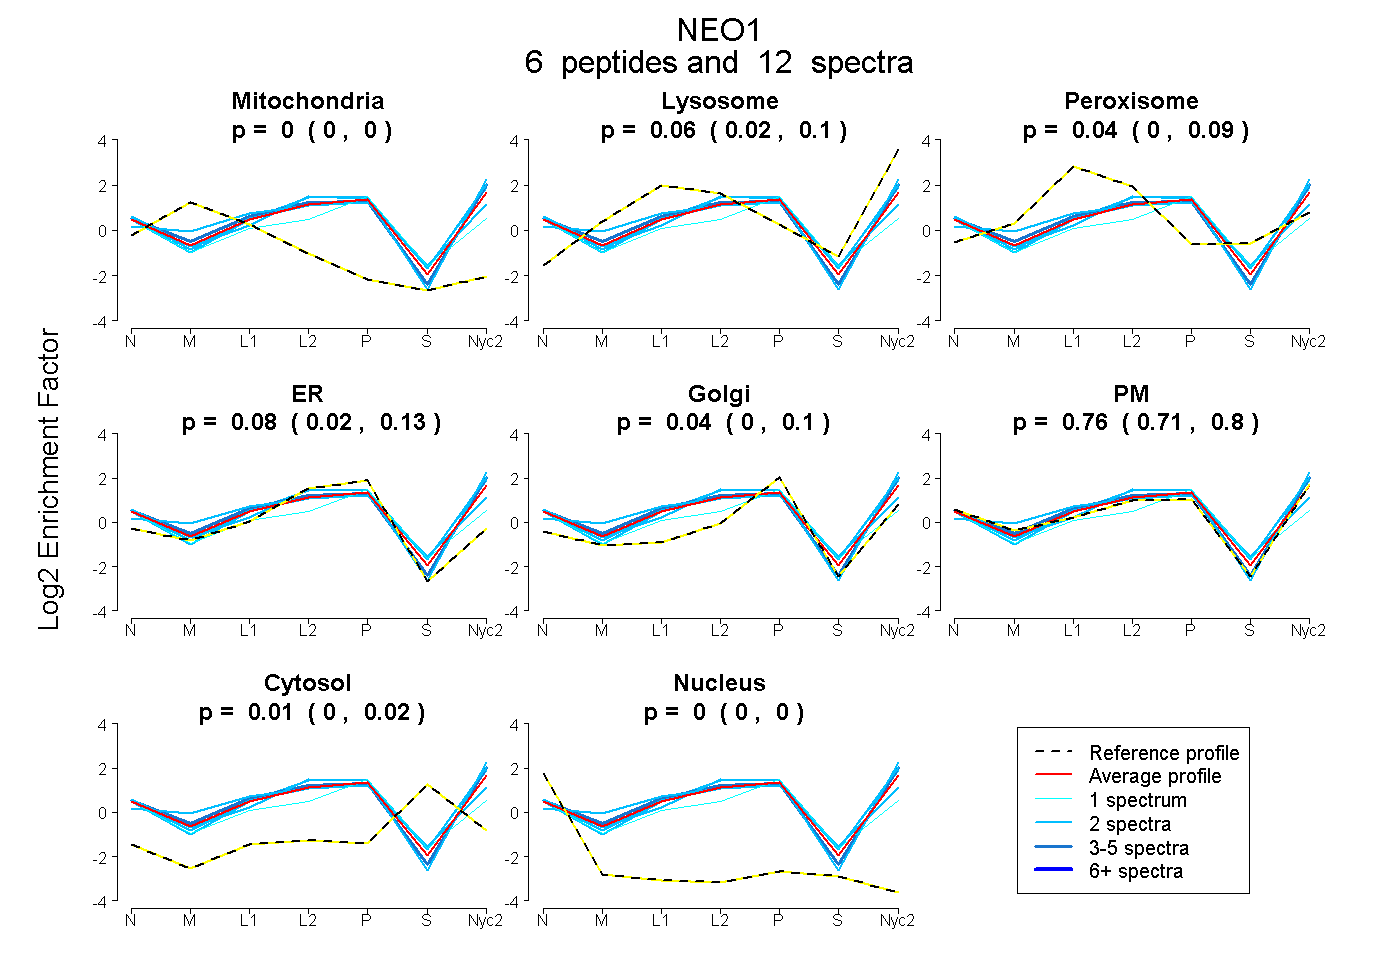 |
0.000
0.000 | 0.000 |
0.063
0.019 | 0.097 |
|
0.044
0.000 | 0.088 |
0.082
0.021 | 0.127 |
0.041
0.000 | 0.105 |
0.762
0.714 | 0.800 |
0.008
0.000 | 0.022 |
0.000
0.000 | 0.000 |
|
| | | Plot |
Mito |
|
Lyso or Perox |
|
ER |
Golgi |
PM |
Cytosol |
Nucleus |
|
| Expt B |
2
peptides |
3
spectra |
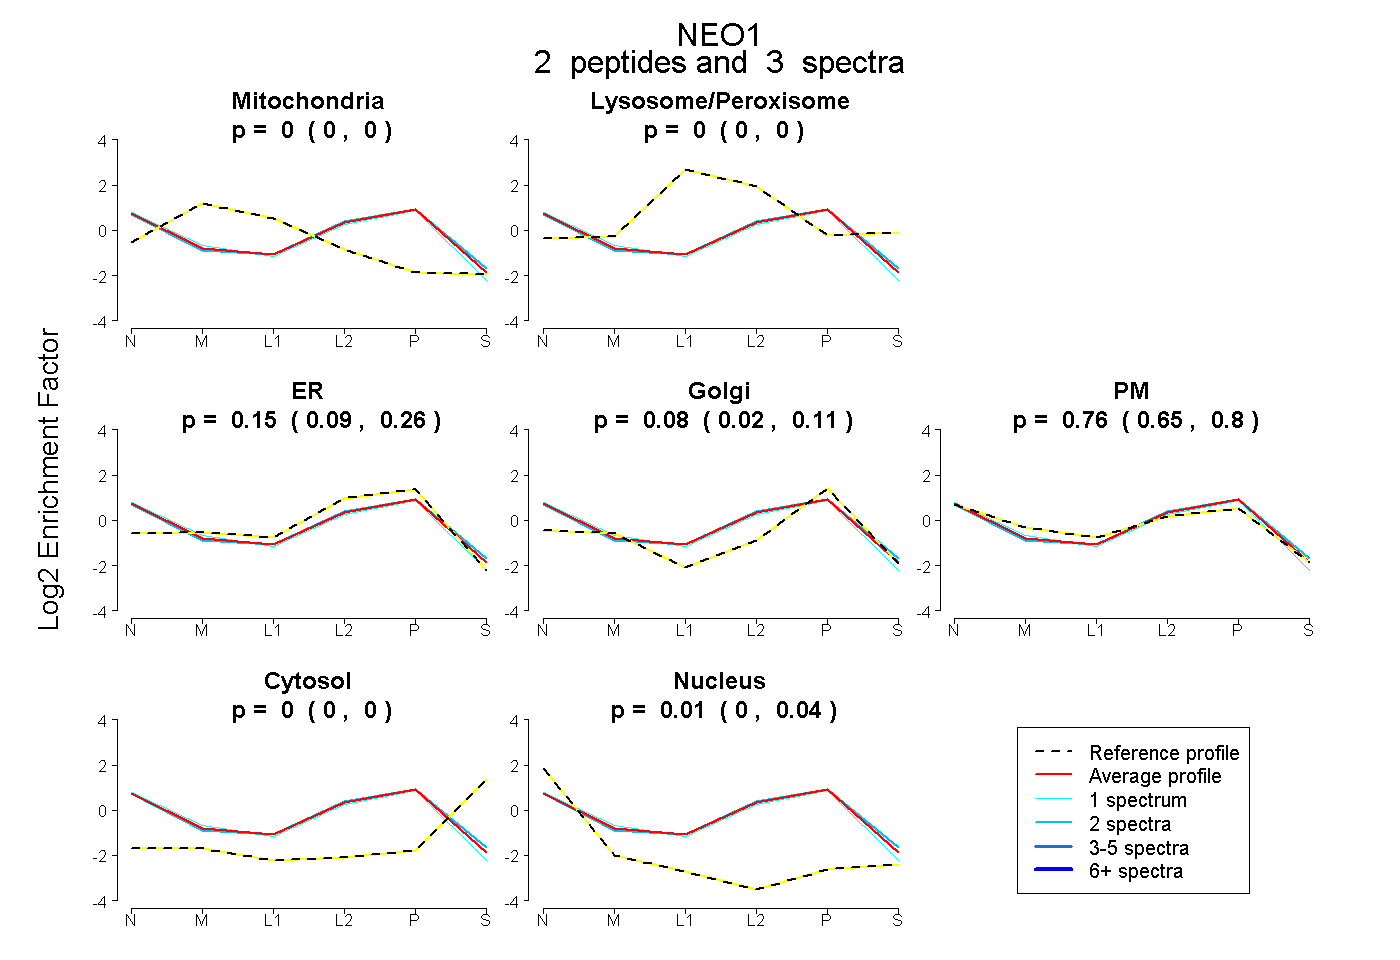 |
0.000
0.000 | 0.000 |
|
0.000
0.000 | 0.000 |
|
0.152
0.093 | 0.259 |
0.079
0.024 | 0.107 |
0.760
0.650 | 0.804 |
0.000
0.000 | 0.004 |
0.009
0.000 | 0.042 |
|
| | | Plot |
|
Lyso |
|
|
|
|
|
|
|
Other |
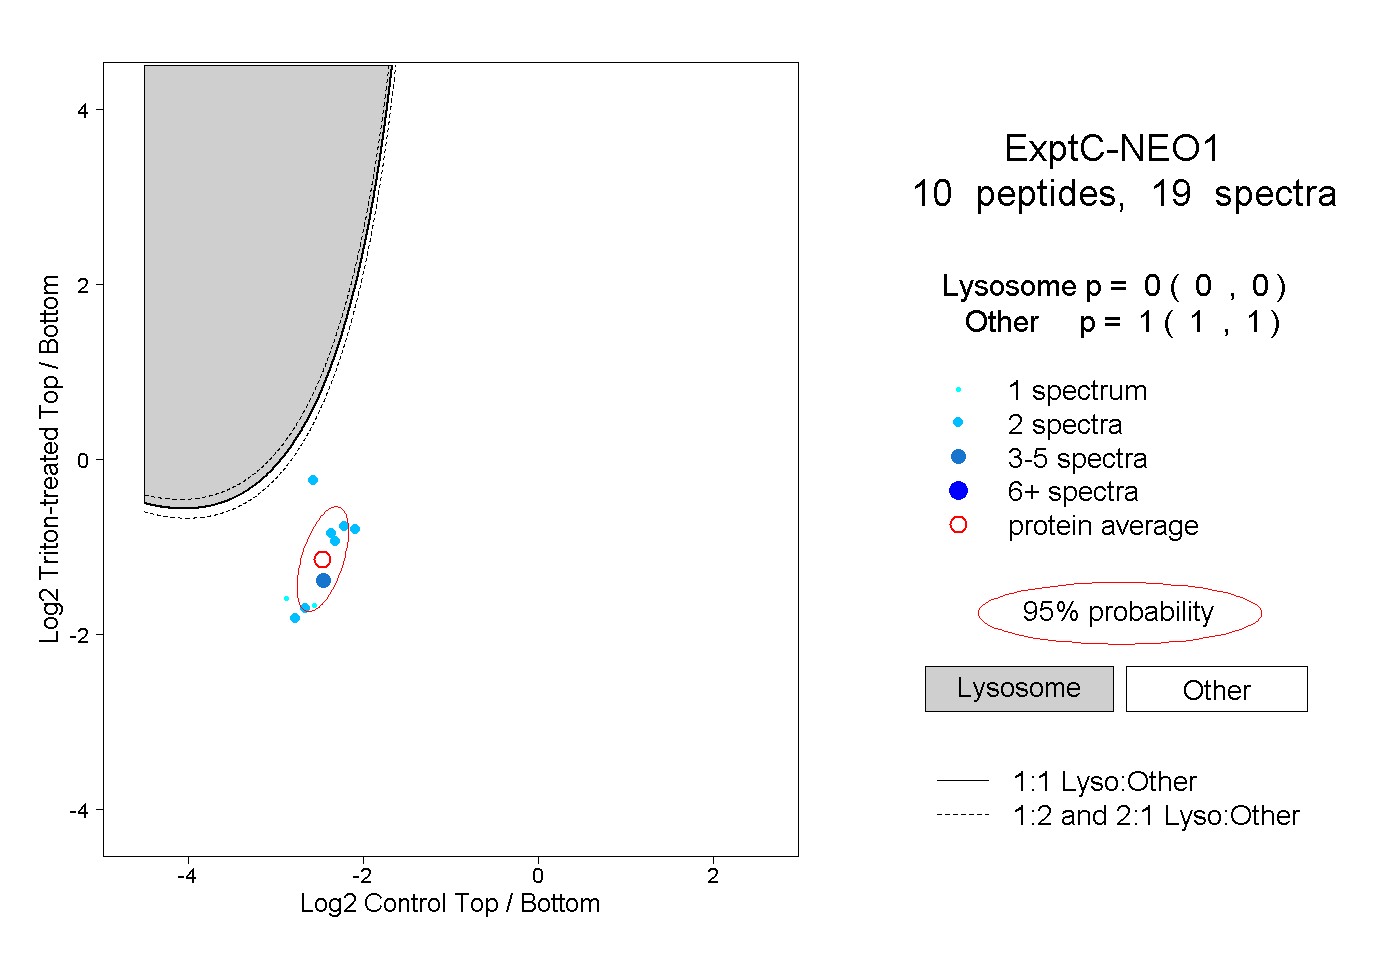
| Expt C |
10
peptides |
19
spectra |
 |
|
0.000
0.000 | 0.000 |
|
|
|
|
|
|
|
1.000
1.000 | 1.000 |
| 2 spectra, GTEYNFR |
|
0.000 |
|
|
|
|
|
|
|
1.000 |
| 2 spectra, LELKPIDK |
|
0.000 |
|
|
|
|
|
|
|
1.000 |
| 2 spectra, LAVAGLPR |
|
0.000 |
|
|
|
|
|
|
|
1.000 |
| 2 spectra, YTEYSFR |
|
0.000 |
|
|
|
|
|
|
|
1.000 |
| 1 spectrum, EHNLQVLGLVK |
|
0.000 |
|
|
|
|
|
|
|
1.000 |
| 2 spectra, NEDVLDTESSGR |
|
0.000 |
|
|
|
|
|
|
|
1.000 |
| 3 spectra, TNIPANTK |
|
0.000 |
|
|
|
|
|
|
|
1.000 |
| 2 spectra, QPANIYAR |
|
0.001 |
|
|
|
|
|
|
|
0.999 |
| 2 spectra, QPLLLDDR |
|
0.000 |
|
|
|
|
|
|
|
1.000 |
| 1 spectrum, TTSHQK |
|
0.000 |
|
|
|
|
|
|
|
1.000 |
| | | Plot |
|
Lyso |
|
|
|
|
|
|
|
Other |
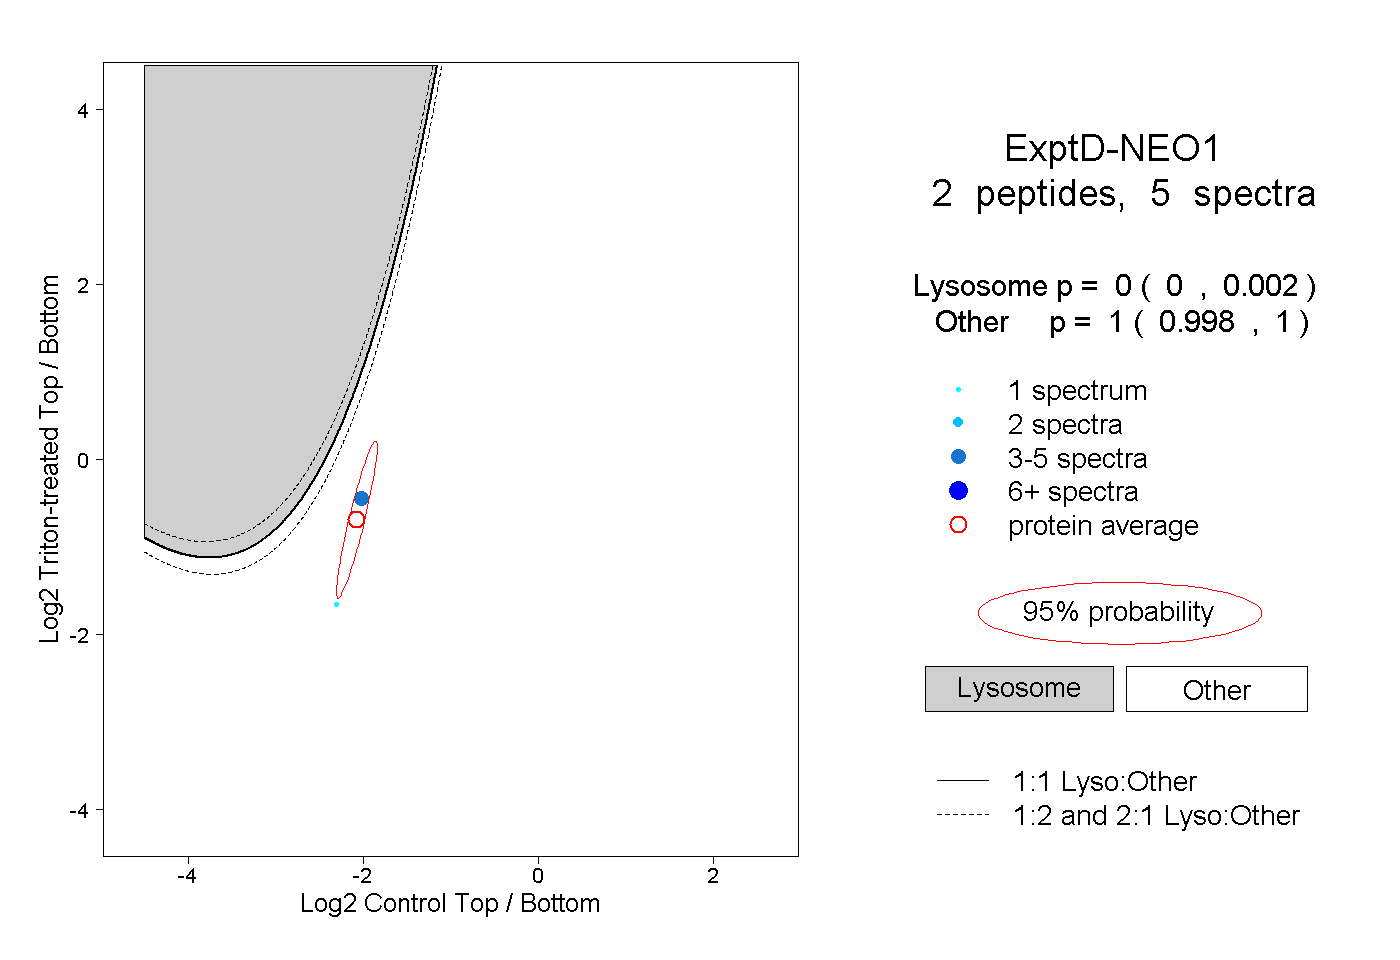
| Expt D |
2
peptides |
5
spectra |
 |
|
0.000
0.000 | 0.002 |
|
|
|
|
|
|
|
1.000
0.998 | 1.000 |