 6
6peptides
spectra
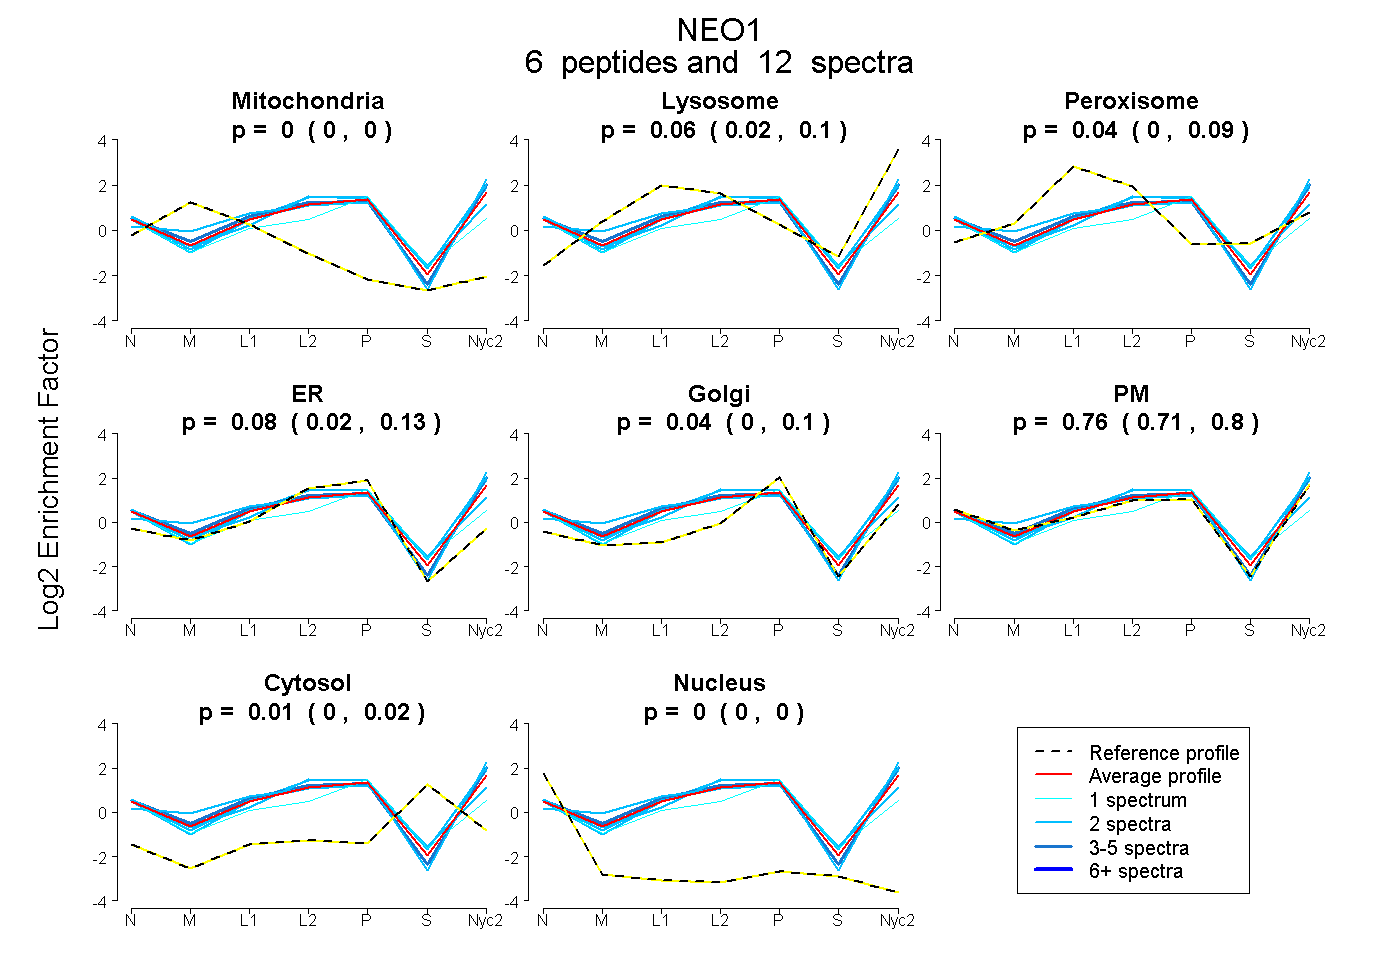
0.000 | 0.000
0.019 | 0.097
0.000 | 0.088
0.021 | 0.127
0.000 | 0.105
0.714 | 0.800
0.000 | 0.022
0.000 | 0.000
| Plot | Mito | Lyso | Perox | ER | Golgi | PM | Cytosol | Nucleus | |||||
| Expt A |
6 peptides |
12 spectra |
|
0.000 0.000 | 0.000 |
0.063 0.019 | 0.097 |
0.044 0.000 | 0.088 |
0.082 0.021 | 0.127 |
0.041 0.000 | 0.105 |
0.762 0.714 | 0.800 |
0.008 0.000 | 0.022 |
0.000 0.000 | 0.000 |
| 1 spectrum, SRPPMPVVVPSAPEVQEATR | 0.000 | 0.000 | 0.028 | 0.250 | 0.171 | 0.424 | 0.117 | 0.010 | ||
| 3 spectra, DVVASLVSTR | 0.000 | 0.096 | 0.000 | 0.006 | 0.000 | 0.898 | 0.000 | 0.000 | ||
| 2 spectra, EMAHLEGLMK | 0.000 | 0.001 | 0.296 | 0.050 | 0.227 | 0.426 | 0.000 | 0.000 | ||
| 2 spectra, NEDVLDTESSGR | 0.000 | 0.039 | 0.000 | 0.000 | 0.000 | 0.961 | 0.000 | 0.000 | ||
| 2 spectra, ANSTESVR | 0.000 | 0.134 | 0.000 | 0.113 | 0.000 | 0.725 | 0.028 | 0.000 | ||
| 2 spectra, QPANIYAR | 0.000 | 0.121 | 0.000 | 0.000 | 0.012 | 0.835 | 0.032 | 0.000 |
| Plot | Mito | Lyso or Perox | ER | Golgi | PM | Cytosol | Nucleus | ||||||
| Expt B |
2 peptides |
3 spectra |
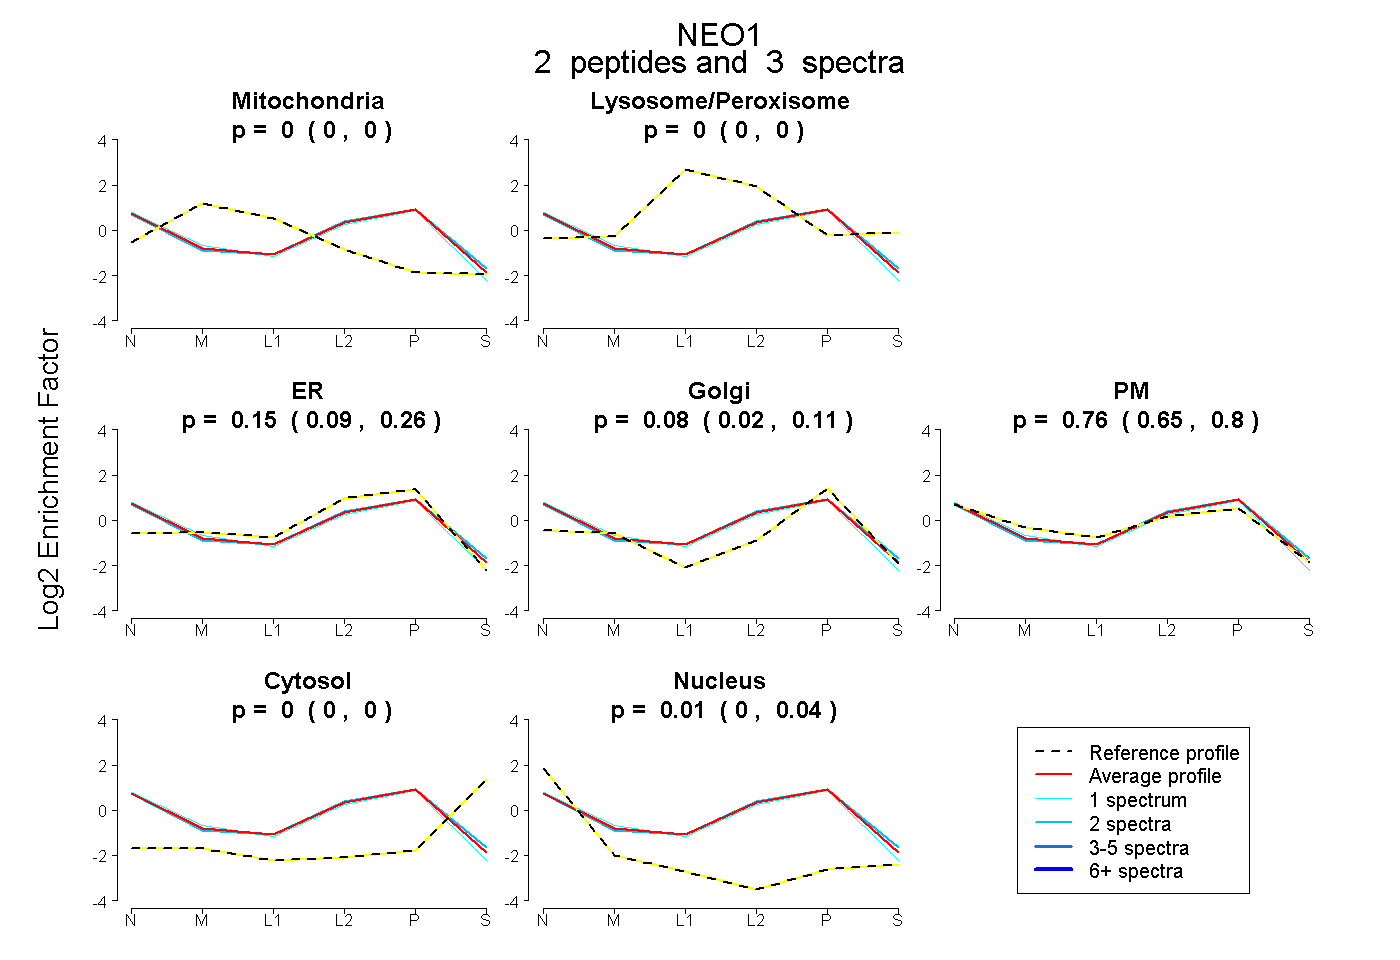 |
0.000 0.000 | 0.000 |
0.000 0.000 | 0.000 |
0.152 0.093 | 0.259 |
0.079 0.024 | 0.107 |
0.760 0.650 | 0.804 |
0.000 0.000 | 0.004 |
0.009 0.000 | 0.042 |
|||
| Plot | Lyso | Other | |||||||||||
| Expt C |
10 peptides |
19 spectra |
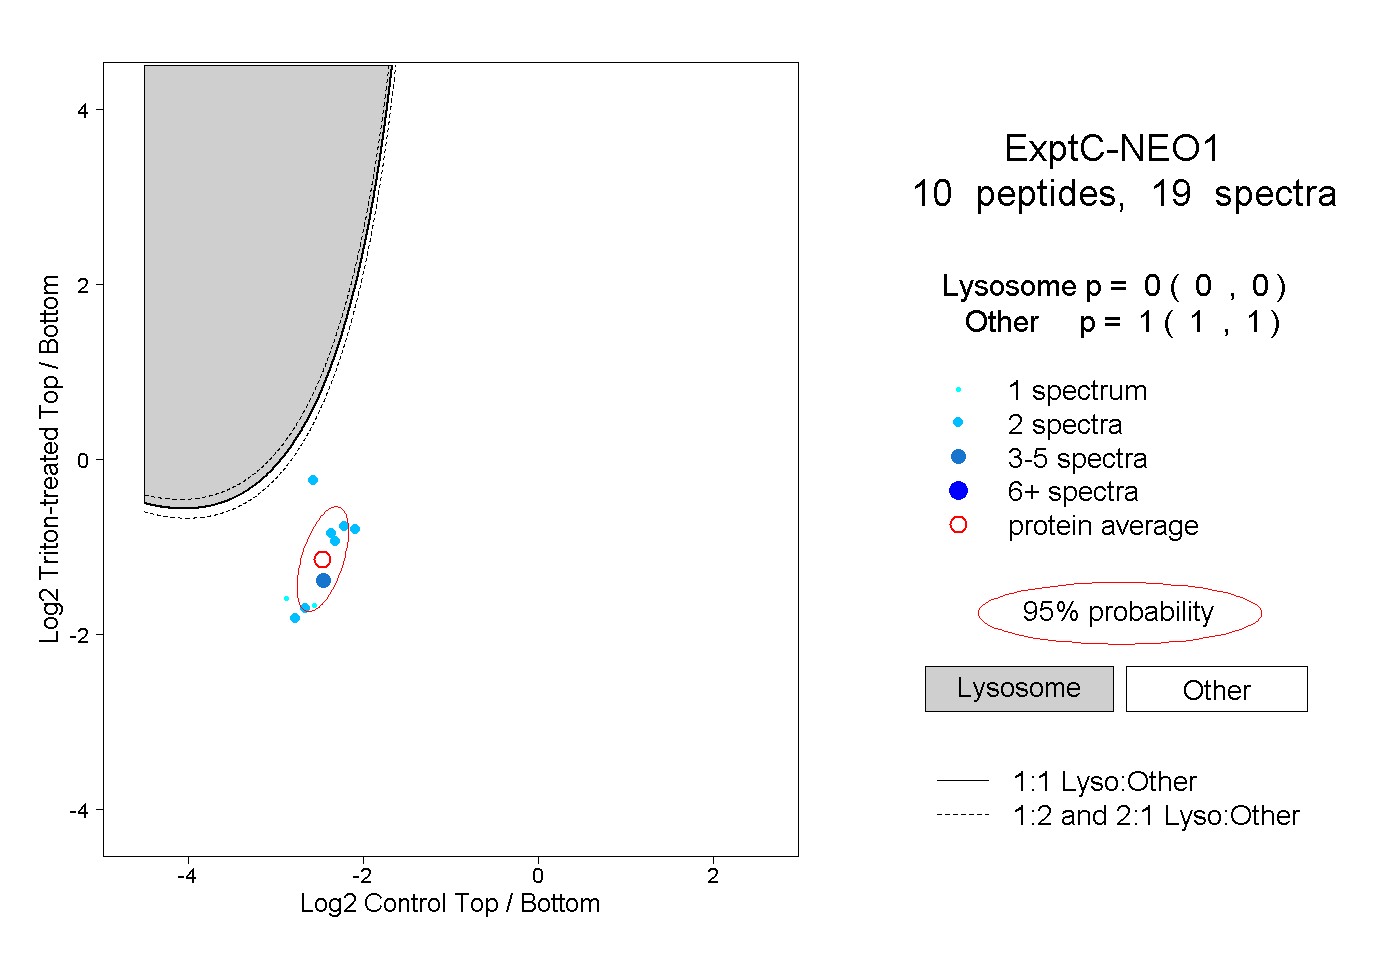 |
0.000 0.000 | 0.000 |
1.000 1.000 | 1.000 |
||||||||
| Plot | Lyso | Other | |||||||||||
| Expt D |
2 peptides |
5 spectra |
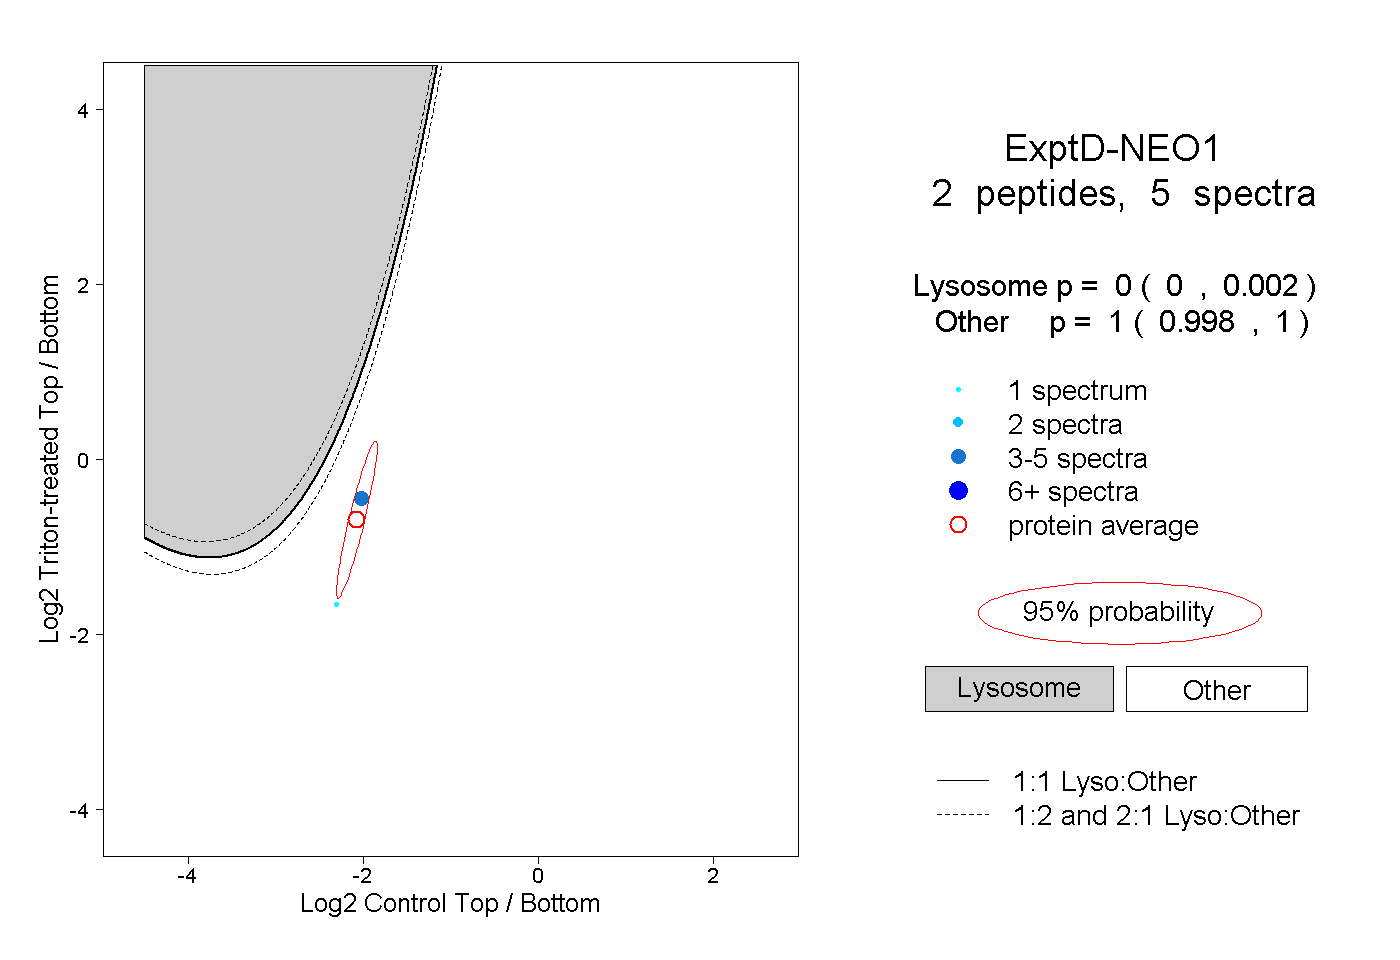 |
0.000 0.000 | 0.002 |
1.000 0.998 | 1.000 |