 8
8peptides
spectra
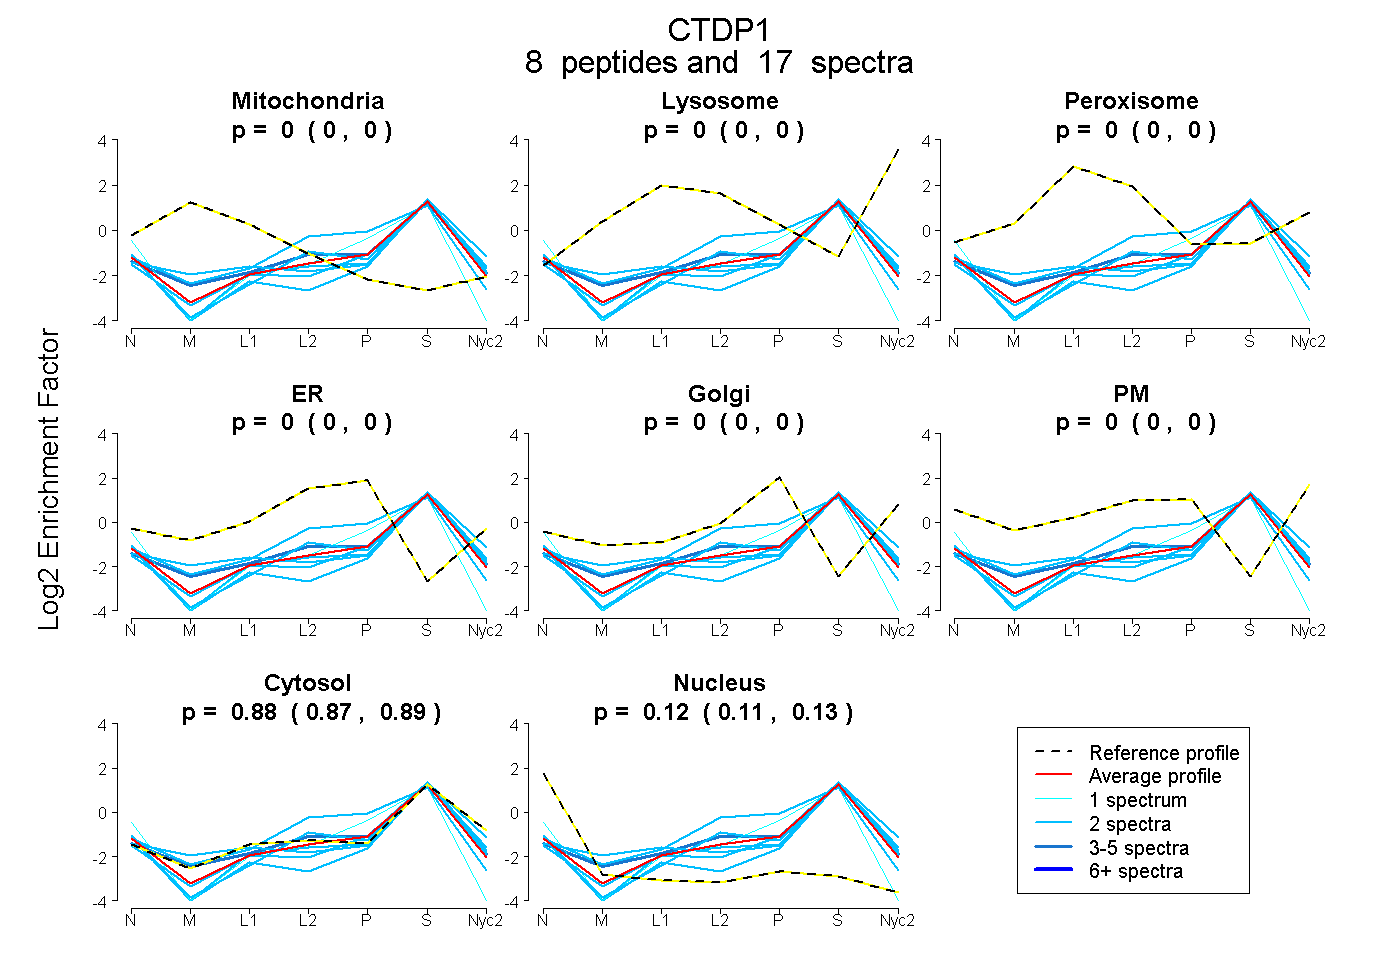
0.000 | 0.000
0.000 | 0.000
0.000 | 0.000
0.000 | 0.000
0.000 | 0.000
0.000 | 0.000
0.871 | 0.892
0.106 | 0.127
2peptides
spectra
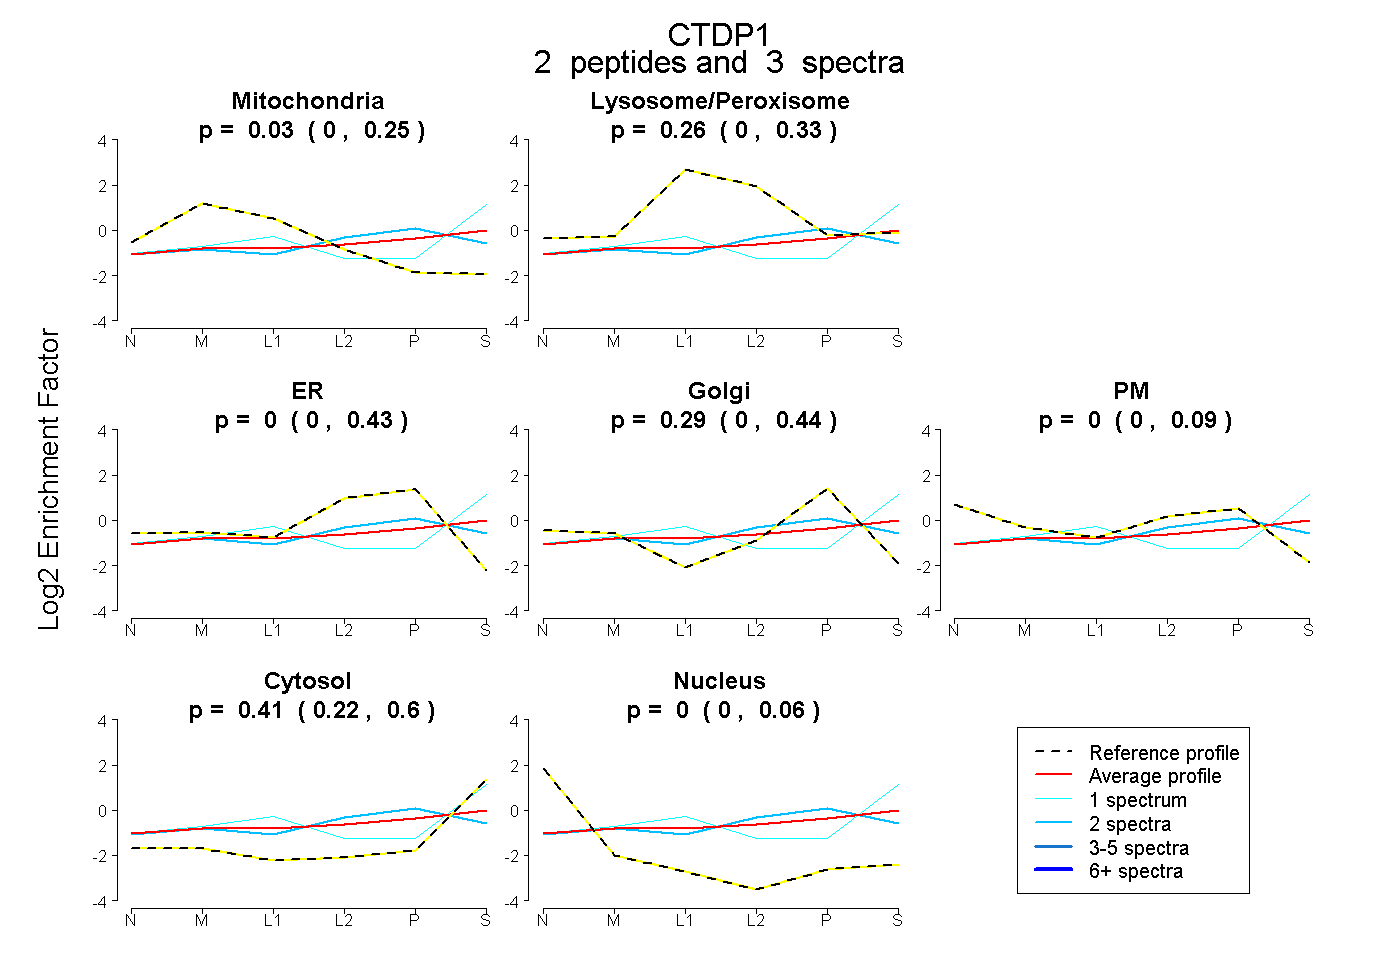
0.000 | 0.246
0.000 | 0.328
0.000 | 0.425
0.000 | 0.441
0.000 | 0.092
0.218 | 0.598
0.000 | 0.059