CTDP1
[ENSRNOP00000060333]
Main page
| | | Plot |
Mito |
Lyso |
|
Perox |
ER |
Golgi |
PM |
Cytosol |
Nucleus |
|
| Expt A |
 8
8
peptides |
17
spectra |
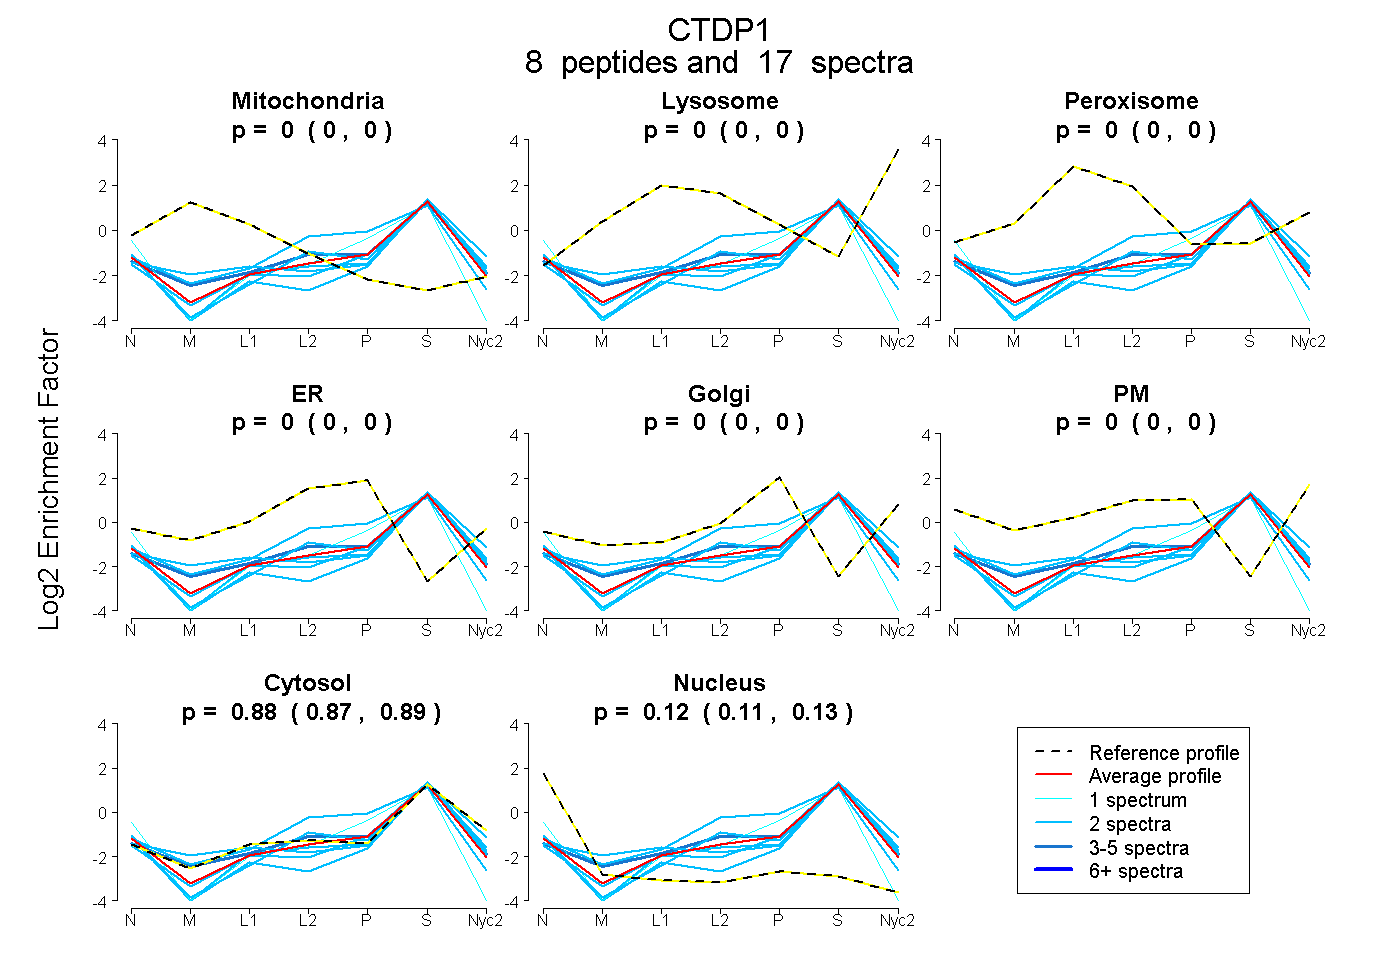 |
0.000
0.000 | 0.000 |
0.000
0.000 | 0.000 |
|
0.000
0.000 | 0.000 |
0.000
0.000 | 0.000 |
0.000
0.000 | 0.000 |
0.000
0.000 | 0.000 |
0.882
0.871 | 0.892 |
0.118
0.106 | 0.127 |
|
| | | Plot |
Mito |
|
Lyso or Perox |
|
ER |
Golgi |
PM |
Cytosol |
Nucleus |
|
| Expt B |
2
peptides |
3
spectra |
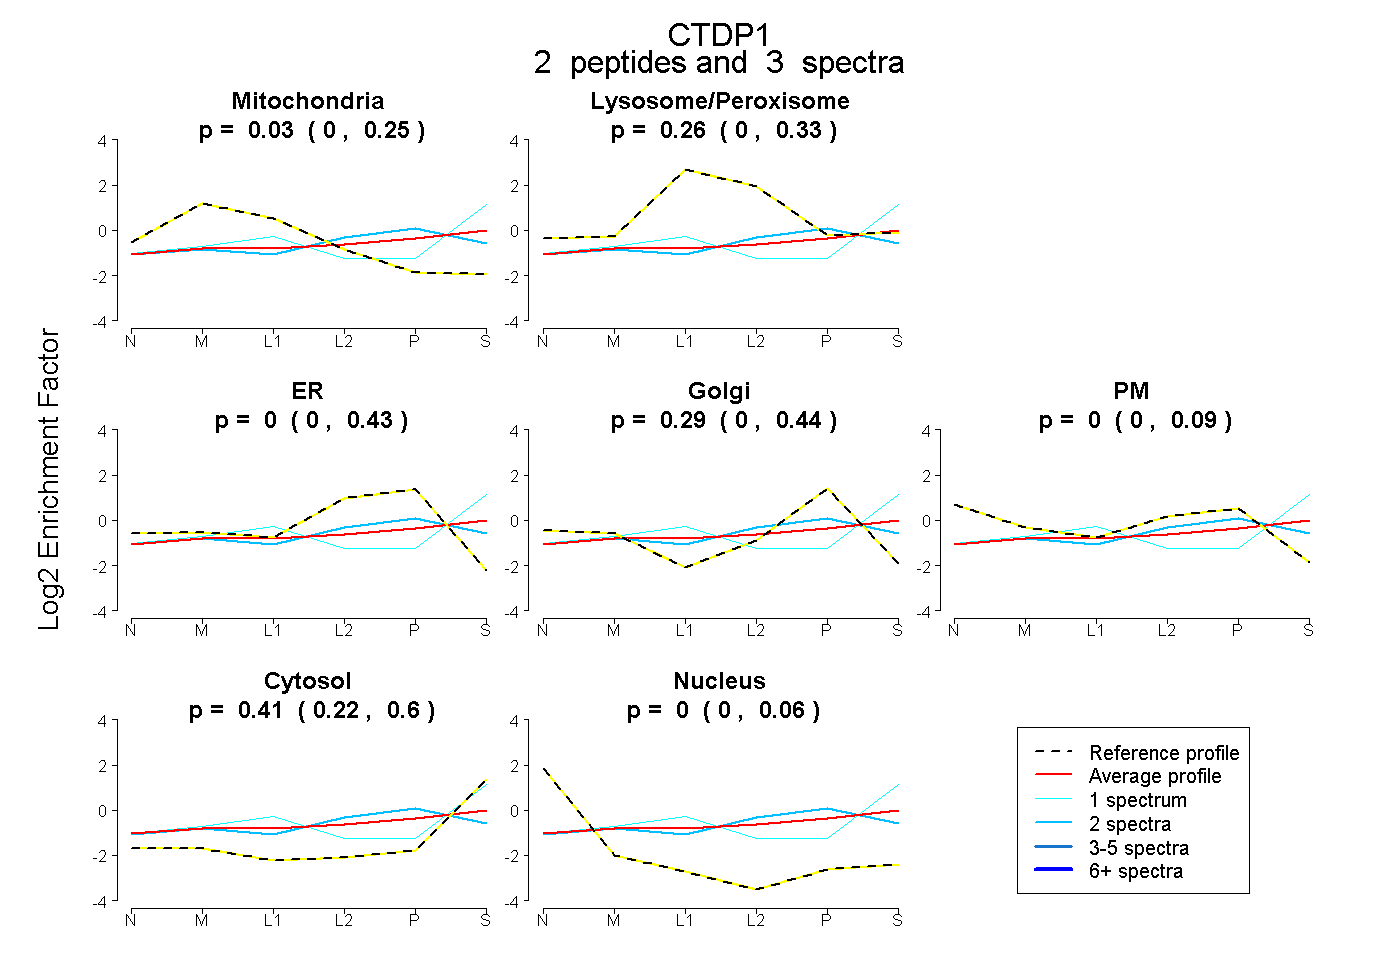 |
0.028
0.000 | 0.246 |
|
0.263
0.000 | 0.328 |
|
0.000
0.000 | 0.425 |
0.294
0.000 | 0.441 |
0.000
0.000 | 0.092 |
0.415
0.218 | 0.598 |
0.000
0.000 | 0.059 |
|
| 1 spectrum, LYELHVFTFGSR |
0.078 |
|
0.286 |
|
0.000 |
0.000 |
0.000 |
0.636 |
0.000 |
|
| 2 spectra, ATHLIAAR |
0.013 |
|
0.106 |
|
0.380 |
0.136 |
0.000 |
0.365 |
0.000 |
|