 8
8peptides
spectra
0.000 | 0.000
0.000 | 0.000
0.000 | 0.000
0.000 | 0.000
0.000 | 0.000
0.000 | 0.000
0.871 | 0.892
0.106 | 0.127
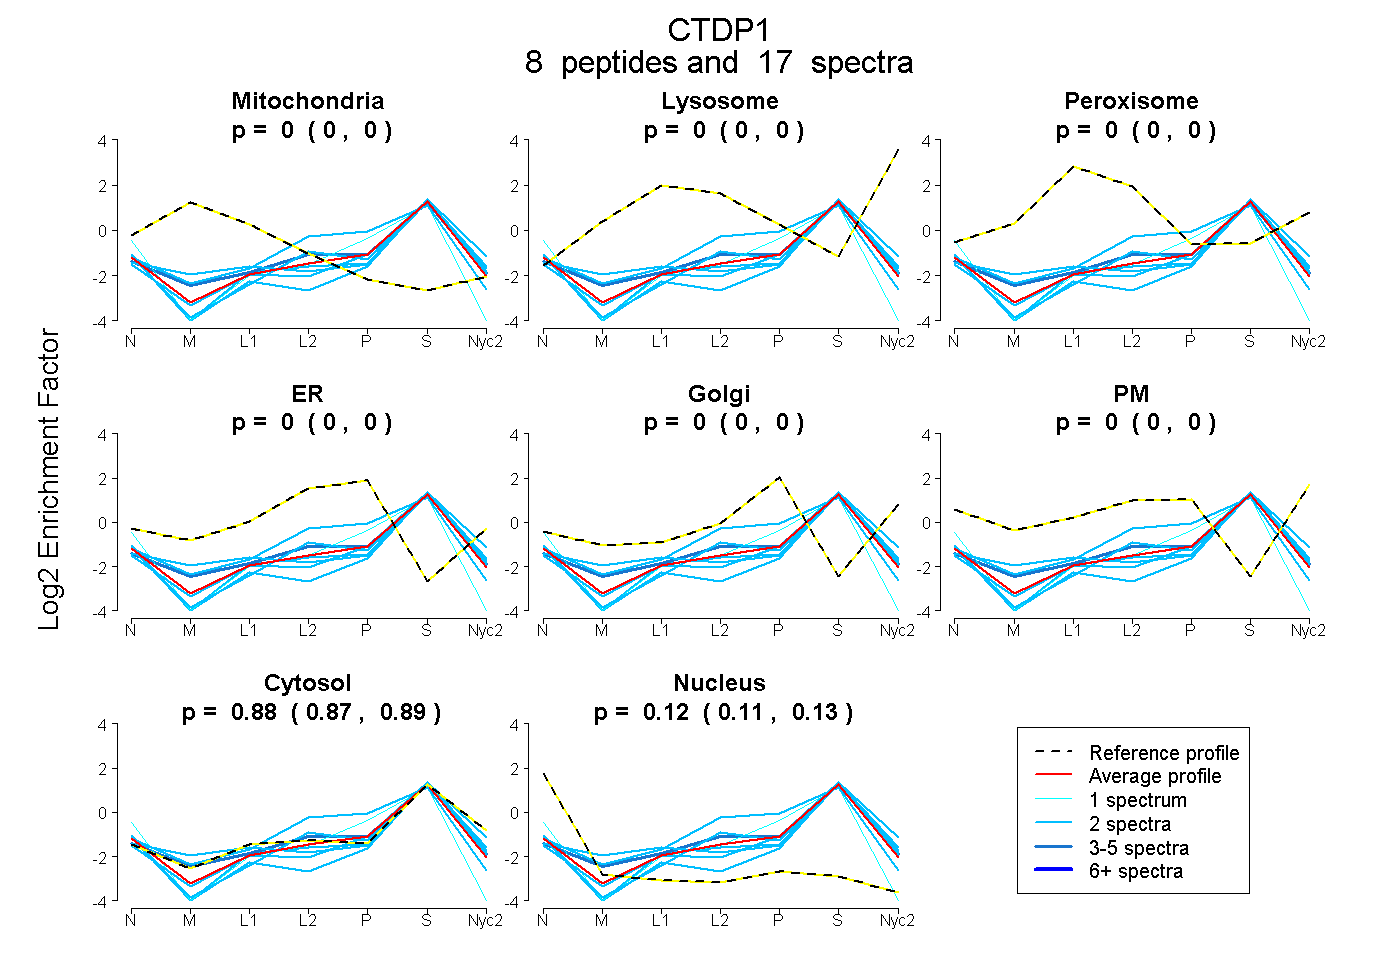
| Plot | Mito | Lyso | Perox | ER | Golgi | PM | Cytosol | Nucleus | |||||
| Expt A |
8 peptides |
17 spectra |
|
0.000 0.000 | 0.000 |
0.000 0.000 | 0.000 |
0.000 0.000 | 0.000 |
0.000 0.000 | 0.000 |
0.000 0.000 | 0.000 |
0.000 0.000 | 0.000 |
0.882 0.871 | 0.892 |
0.118 0.106 | 0.127 |
| 2 spectra, LRPHCK | 0.000 | 0.000 | 0.000 | 0.165 | 0.000 | 0.000 | 0.785 | 0.050 | ||
| 1 spectrum, GIFHFQLGR | 0.000 | 0.000 | 0.000 | 0.000 | 0.000 | 0.000 | 0.700 | 0.300 | ||
| 2 spectra, LEGCSHPVVMK | 0.000 | 0.000 | 0.000 | 0.000 | 0.000 | 0.000 | 0.913 | 0.087 | ||
| 2 spectra, DECIDPFSK | 0.000 | 0.000 | 0.000 | 0.000 | 0.000 | 0.000 | 0.860 | 0.140 | ||
| 2 spectra, LYELHVFTFGSR | 0.049 | 0.000 | 0.000 | 0.000 | 0.000 | 0.000 | 0.875 | 0.076 | ||
| 4 spectra, ATHLIAAR | 0.000 | 0.000 | 0.000 | 0.006 | 0.000 | 0.000 | 0.925 | 0.069 | ||
| 2 spectra, VTAGATVR | 0.000 | 0.000 | 0.000 | 0.000 | 0.000 | 0.000 | 0.897 | 0.103 | ||
| 2 spectra, AASGGCVR | 0.000 | 0.000 | 0.000 | 0.000 | 0.000 | 0.000 | 0.882 | 0.118 |
| Plot | Mito | Lyso or Perox | ER | Golgi | PM | Cytosol | Nucleus | ||||||
| Expt B |
2 peptides |
3 spectra |
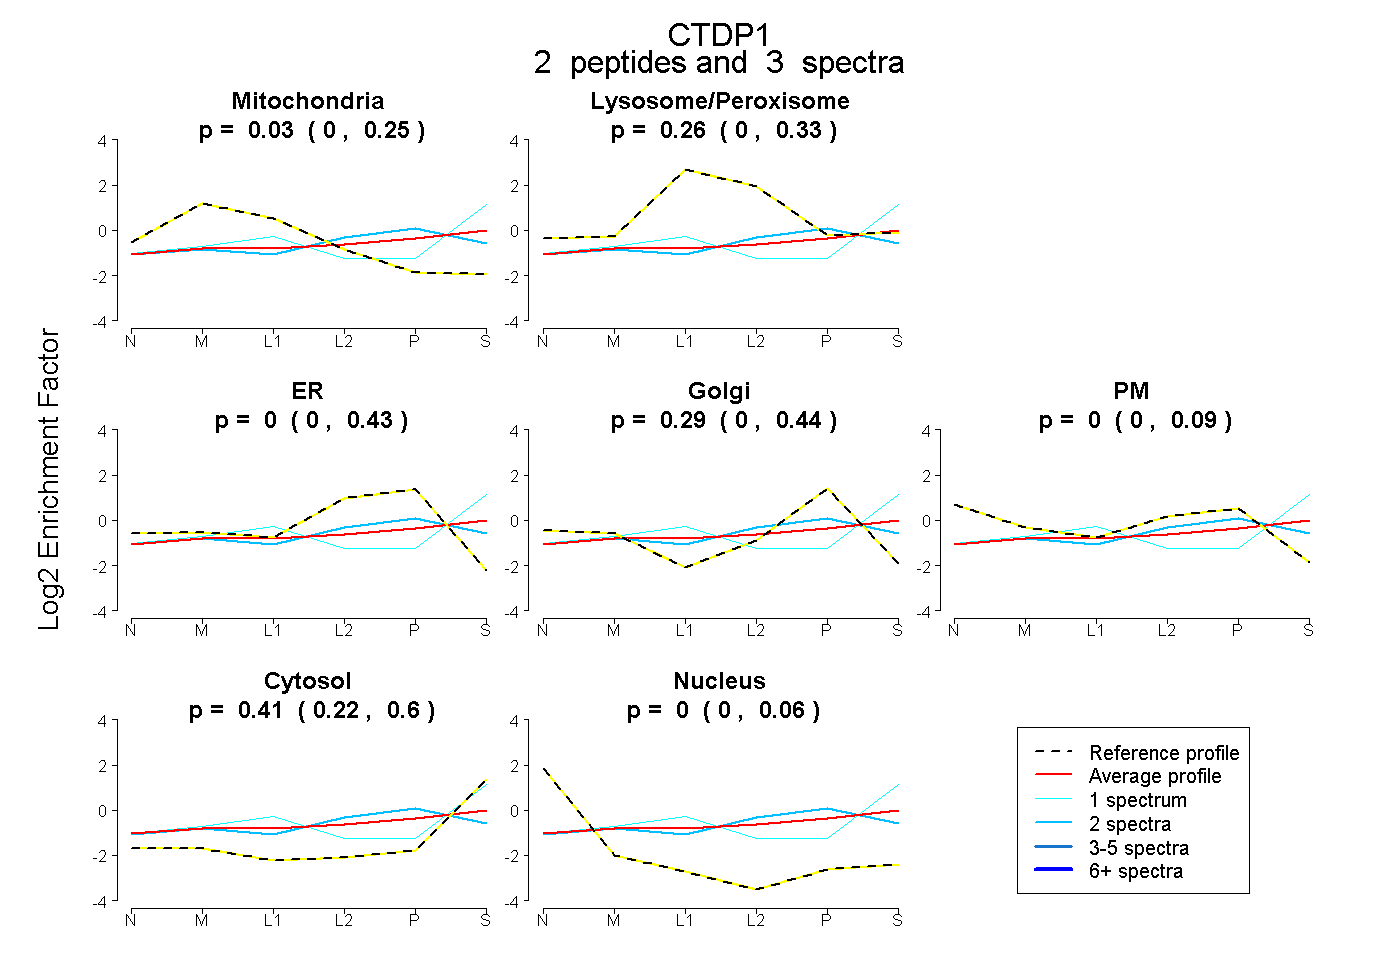 |
0.028 0.000 | 0.246 |
0.263 0.000 | 0.328 |
0.000 0.000 | 0.425 |
0.294 0.000 | 0.441 |
0.000 0.000 | 0.092 |
0.415 0.218 | 0.598 |
0.000 0.000 | 0.059 |