 15
15peptides
spectra
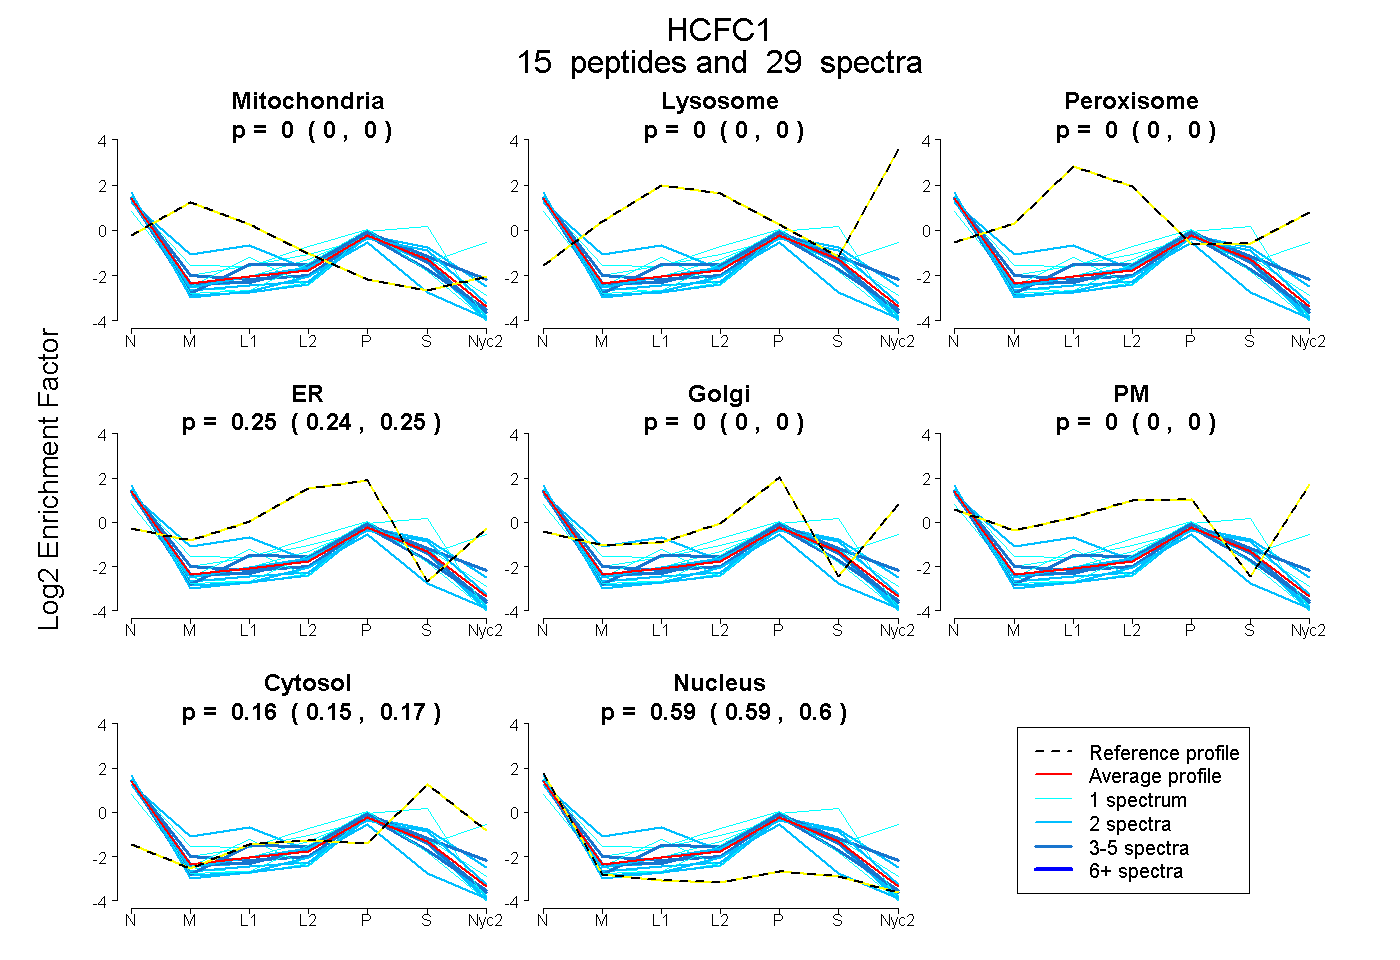
0.000 | 0.000
0.000 | 0.000
0.000 | 0.000
0.240 | 0.253
0.000 | 0.000
0.000 | 0.000
0.149 | 0.168
0.587 | 0.600
3peptides
spectra
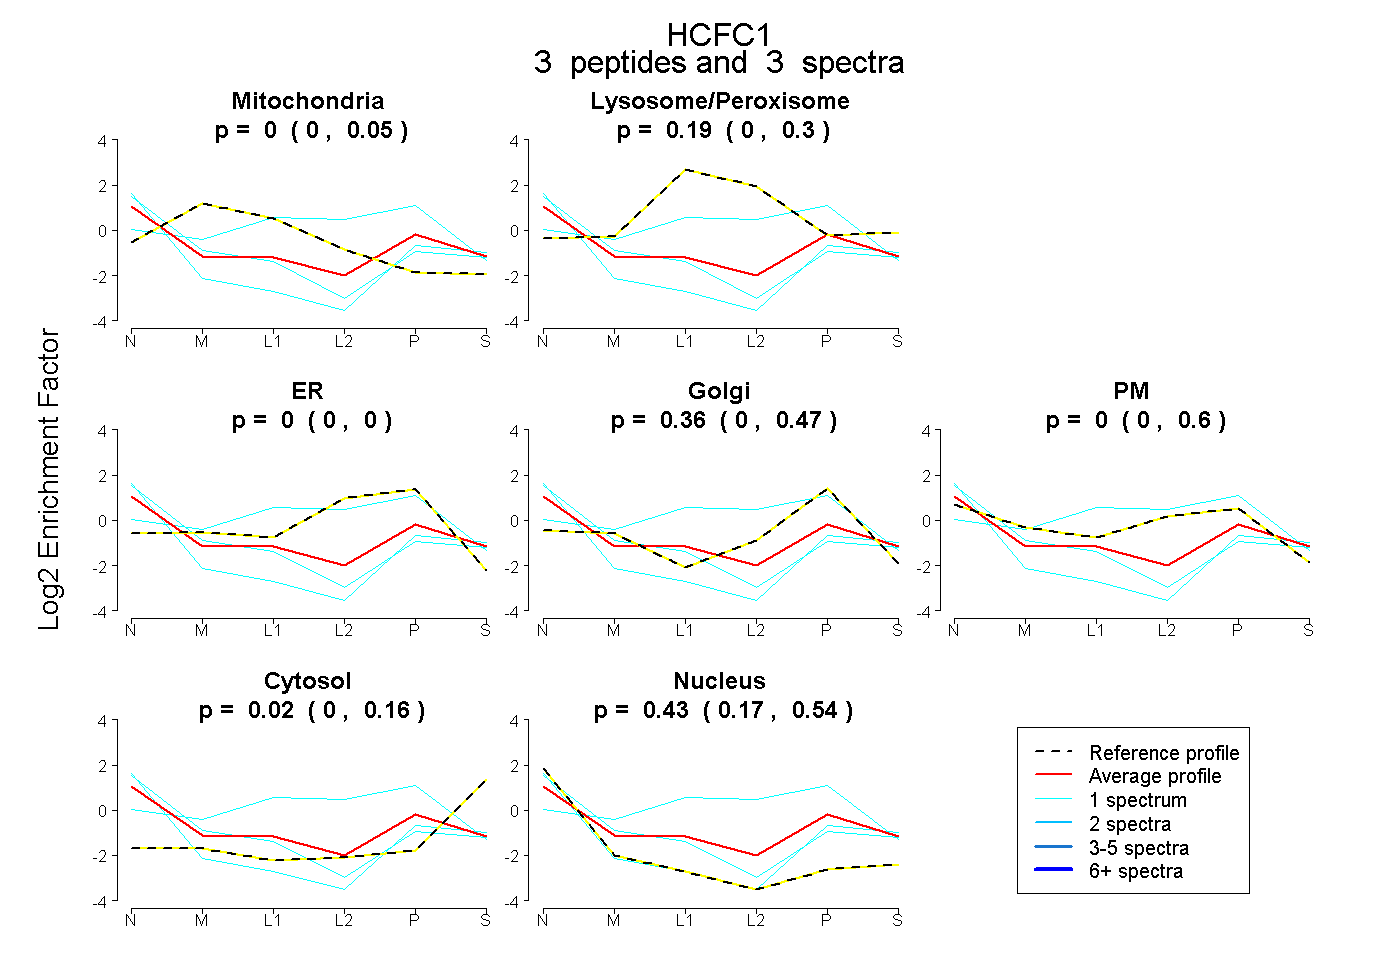
0.000 | 0.050
0.000 | 0.303
0.000 | 0.000
0.000 | 0.468
0.000 | 0.595
0.000 | 0.164
0.166 | 0.538
4peptides
spectra
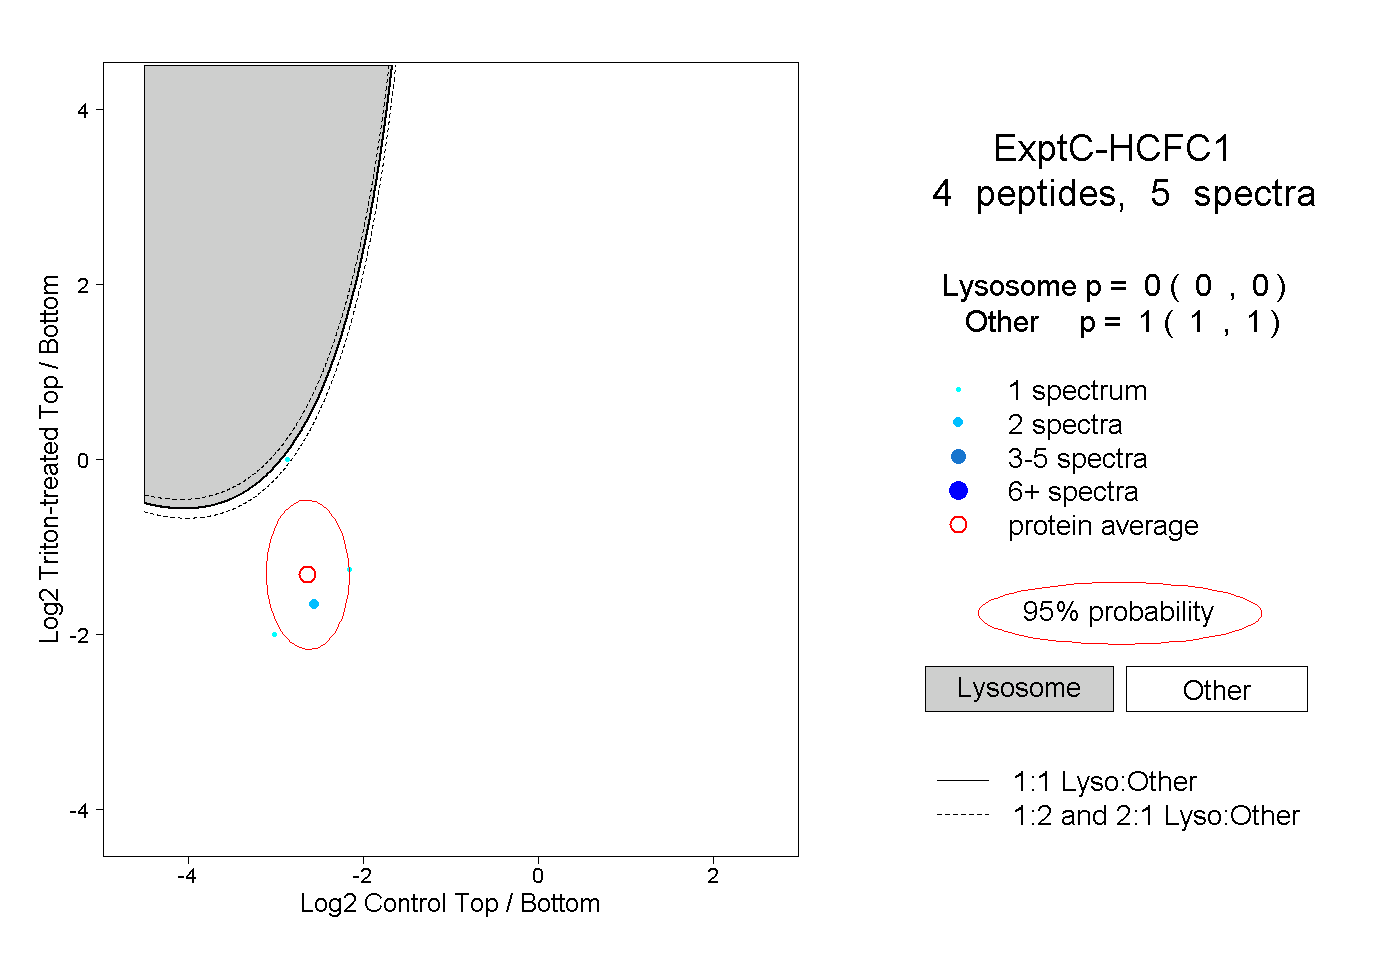
0.000 | 0.000
1.000 | 1.000