HCFC1
[ENSRNOP00000060327]
Main page
| | | Plot |
Mito |
Lyso |
|
Perox |
ER |
Golgi |
PM |
Cytosol |
Nucleus |
|
| Expt A |
 15
15
peptides |
29
spectra |
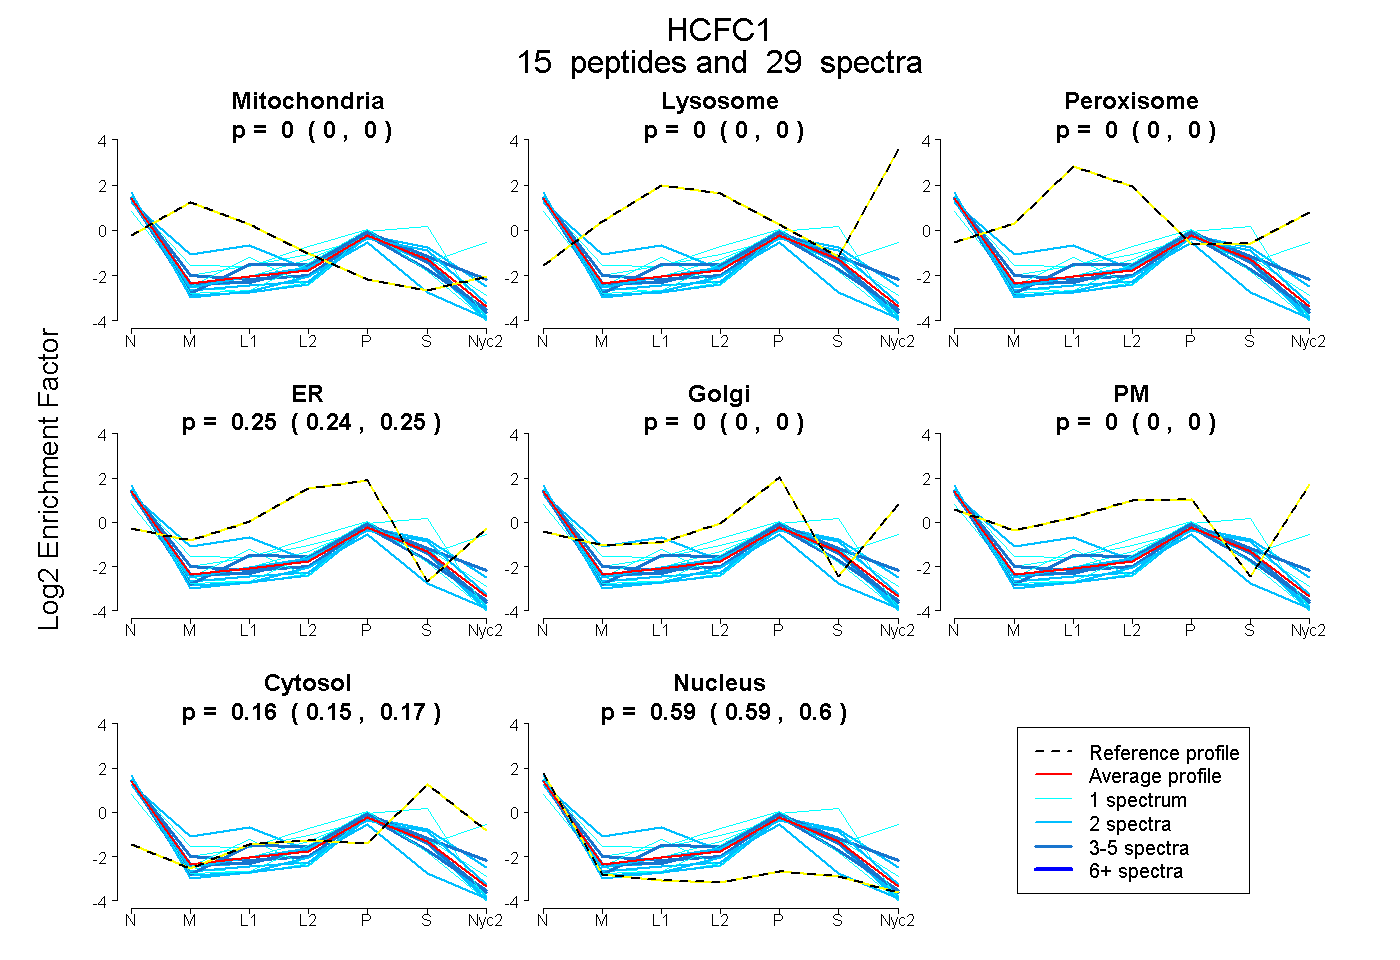 |
0.000
0.000 | 0.000 |
0.000
0.000 | 0.000 |
|
0.000
0.000 | 0.000 |
0.247
0.240 | 0.253 |
0.000
0.000 | 0.000 |
0.000
0.000 | 0.000 |
0.159
0.149 | 0.168 |
0.594
0.587 | 0.600 |
|
| | | Plot |
Mito |
|
Lyso or Perox |
|
ER |
Golgi |
PM |
Cytosol |
Nucleus |
|
| Expt B |
3
peptides |
3
spectra |
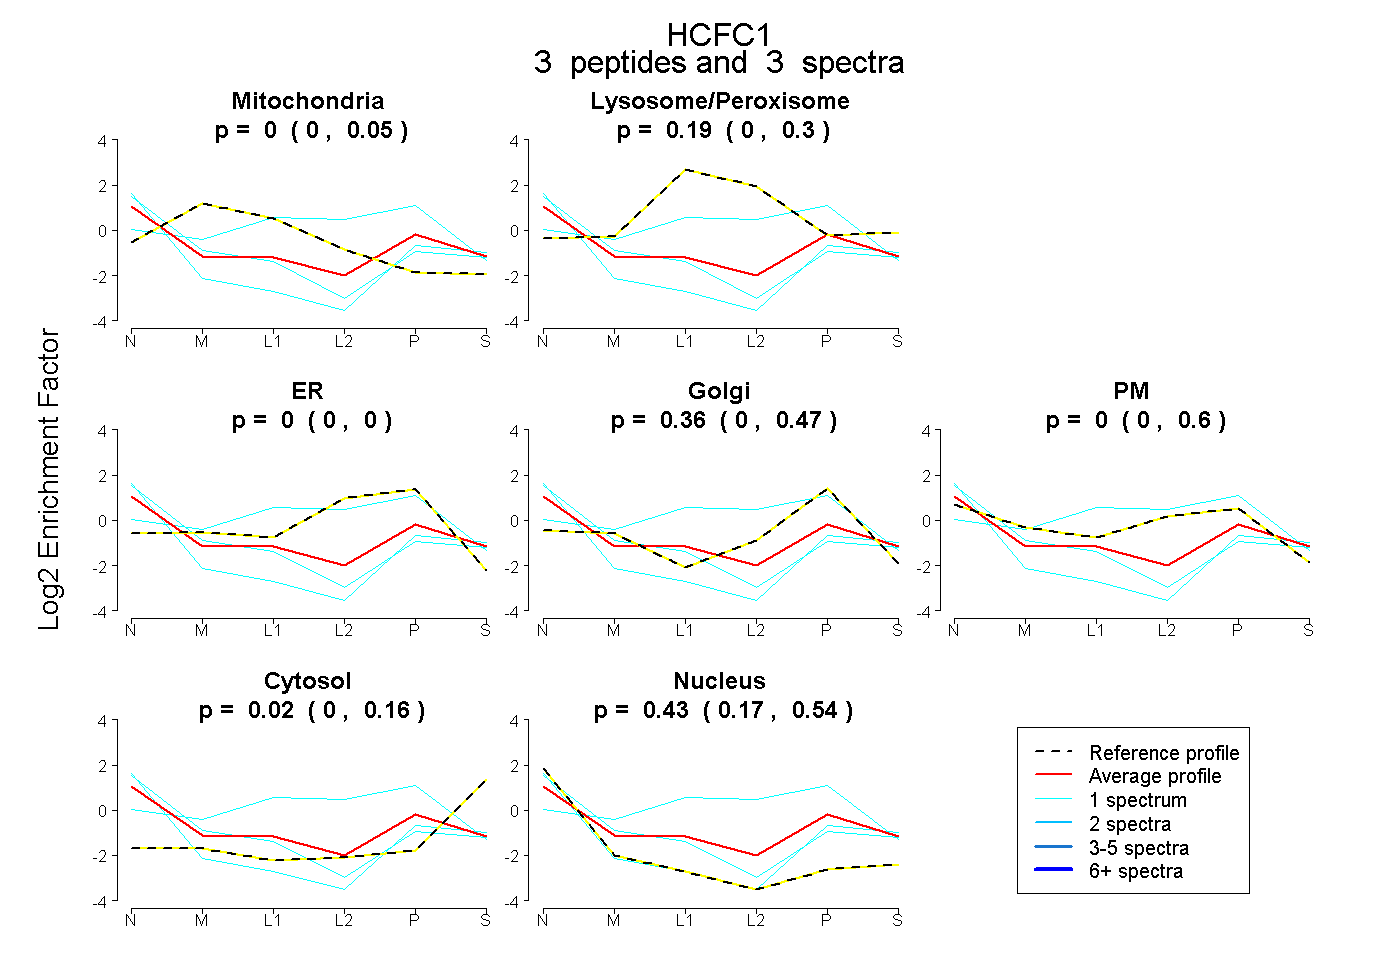 |
0.000
0.000 | 0.050 |
|
0.190
0.000 | 0.303 |
|
0.000
0.000 | 0.000 |
0.356
0.000 | 0.468 |
0.000
0.000 | 0.595 |
0.023
0.000 | 0.164 |
0.431
0.166 | 0.538 |
|
| 1 spectrum, VAGINACGR |
0.030 |
|
0.133 |
|
0.000 |
0.178 |
0.003 |
0.038 |
0.619 |
|
| 1 spectrum, IITAVPK |
0.000 |
|
0.393 |
|
0.132 |
0.275 |
0.201 |
0.000 |
0.000 |
|
| 1 spectrum, GYGPATQVR |
0.000 |
|
0.000 |
|
0.000 |
0.204 |
0.000 |
0.134 |
0.662 |
|
| | | Plot |
|
Lyso |
|
|
|
|
|
|
|
Other |
| Expt C |
4
peptides |
5
spectra |
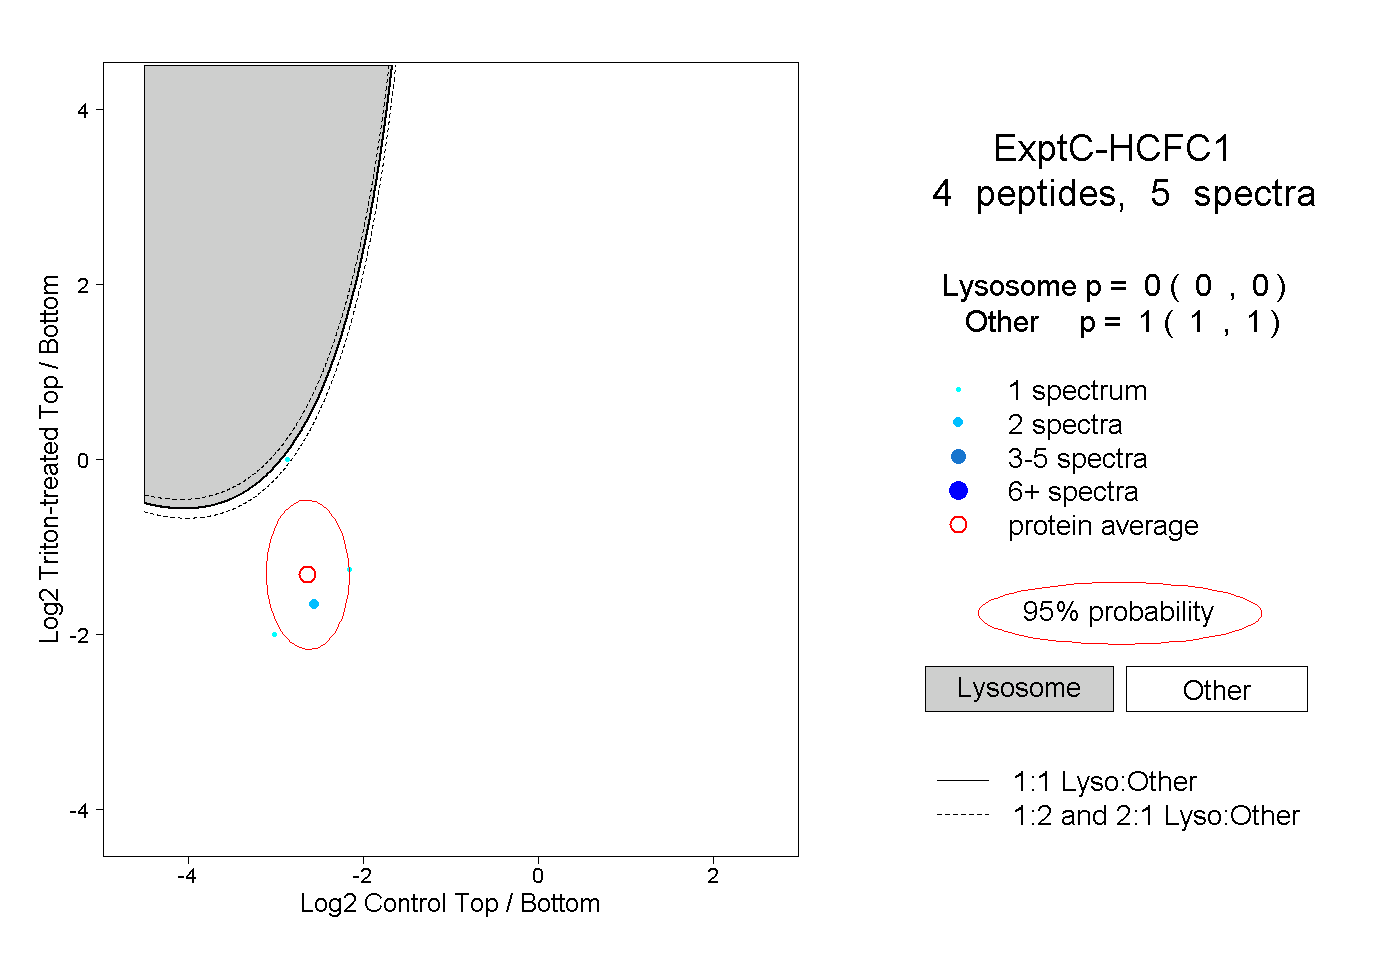 |
|
0.000
0.000 | 0.000 |
|
|
|
|
|
|
|
1.000
1.000 | 1.000 |